
Not current conditions
No Santa Clara County creek crosses a flood threshold.
The closest is Berryessa Creek at Old Piedmont Road, sitting 1.10 feet below its first threshold. 118 of 119 stream gauges are reporting.
Readings captured July 28, 2026 at 4:53 PM PT from Valley Water's public sensor feed.
A network shaped by place
From the foothill reservoirs to the Bay
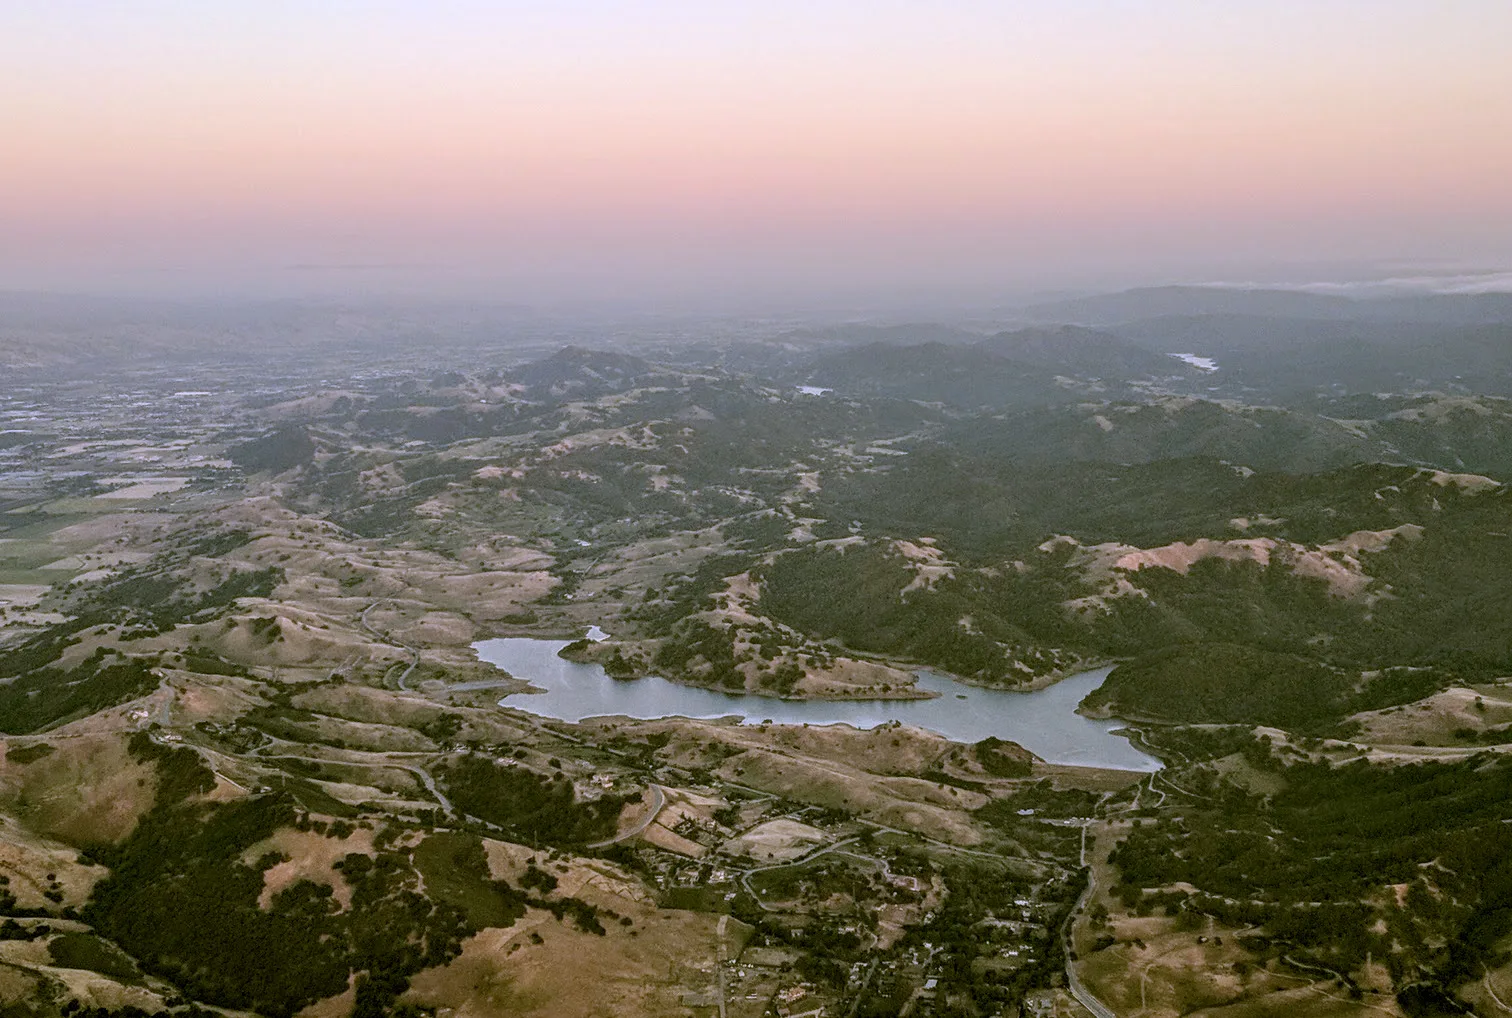
This aerial view of Calero Reservoir shows one of the ten places where winter rain is held above the valley floor.
Who keeps the channel clear
A gauge reads a channel someone maintains
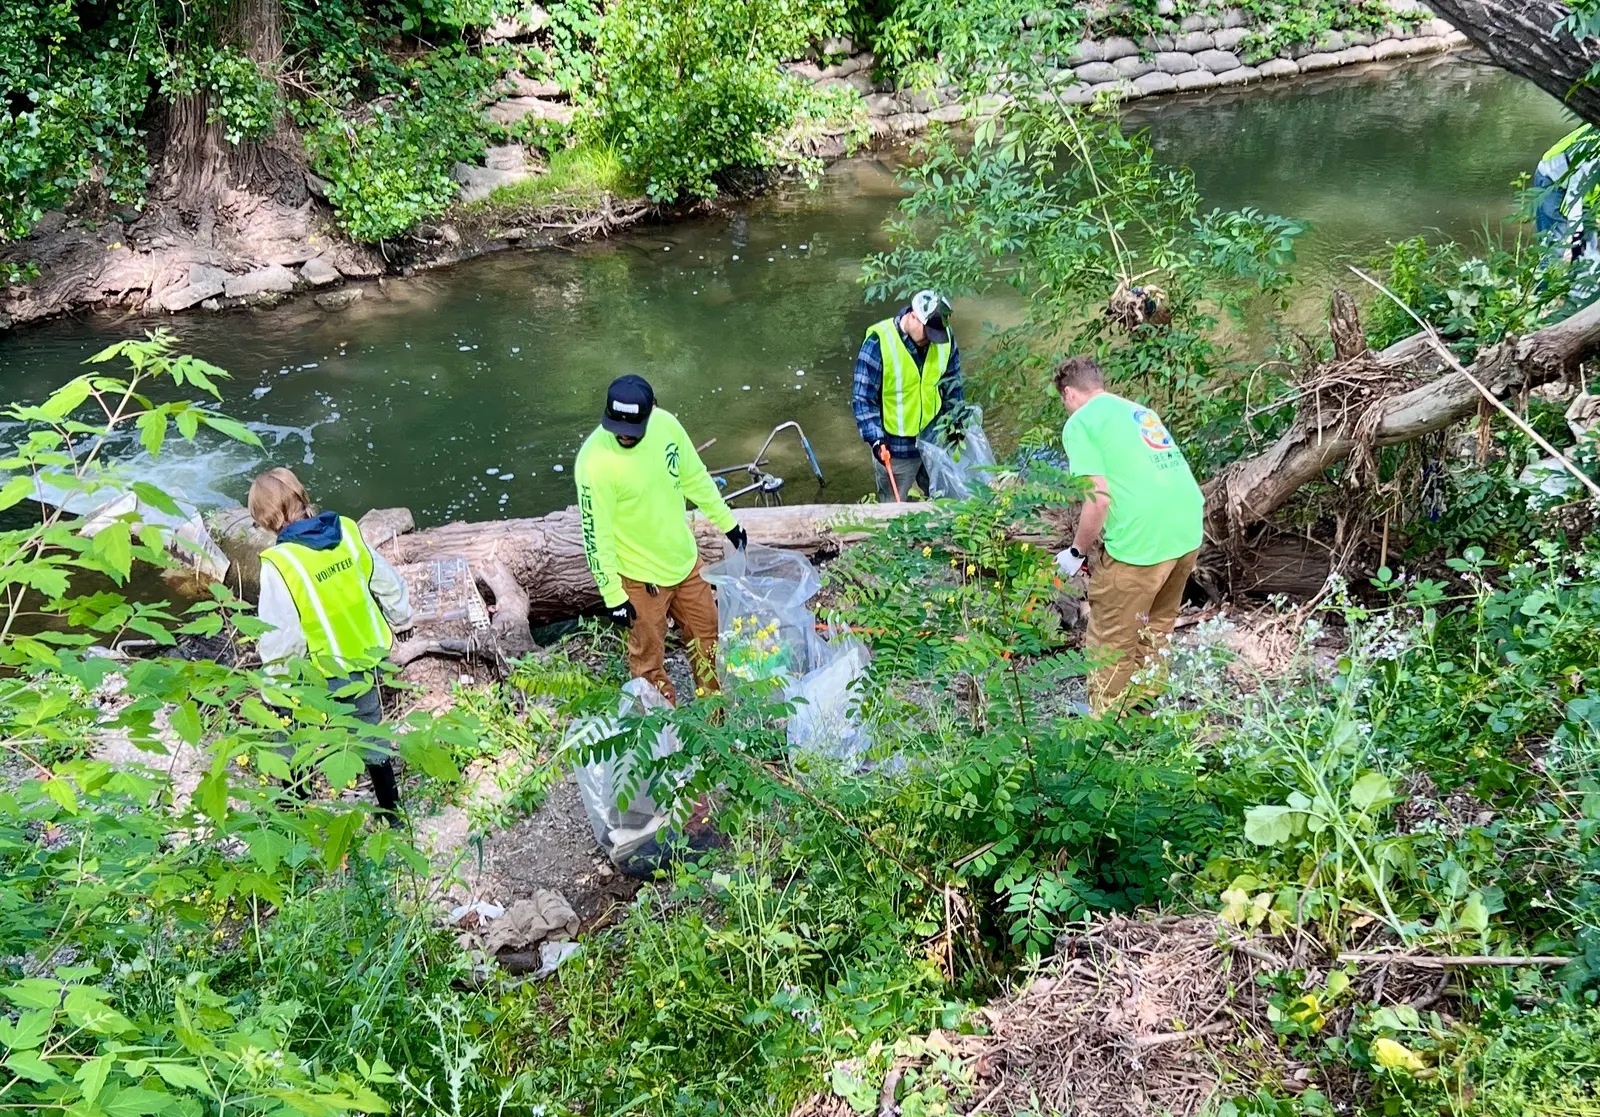
A creek's capacity is not fixed. Fallen wood, sediment and debris change what a channel can carry, and Valley Water crews and volunteers work in these creeks to keep that capacity where the published thresholds assume it is.
Every Gauge in the County
Each bar is one stream gauge, filled to its captured stage and ruled with the flood thresholds Valley Water publishes for that exact location. Every gauge uses its own local scale, so bar heights are meaningful within one gauge and must not be compared as creek depth between stations. The groups and order show how the network runs downstream.
Coyote
Guadalupe
Lower Peninsula
West Valley
Pajaro
Reservoir Storage
Ten reservoirs in the foothills catch winter rain before it reaches the valley floor. Anderson, the largest, has been held far below capacity since 2020 under a federal seismic order.
Rainfall
48 rain gauges reported 0.00 in between them in the last 24 hours. Season totals since October:
| Gauge | Watershed | Last 24 hours | Season to date |
|---|---|---|---|
| Mt Umunhum | Guadalupe | 0.00 in | 49.53 in |
| Valley Christian | West Valley | 0.00 in | 42.05 in |
| Loma Prieta | Pajaro | 0.00 in | 41.61 in |
| Uvas Canyon County Park | Pajaro | 0.00 in | 41.30 in |
| Los Trancos | Lower Peninsula | 0.00 in | 40.87 in |
Is Your Street on the List?
For 32 gauges, Valley Water publishes a written description of exactly what floods at each threshold, naming streets, schools, parks and neighborhoods. This site indexes 146 of those places so you can look yours up directly instead of guessing which sensor applies to you.
- Alma Avenue
- Almaden Expressway
- Arroyo Way
- Atlanta Avenue
- Berryessa Road
- Blach School
- CA-87
- Calero Reservoir
- Canoas Garden Neighborhood
- Capitol Avenue
- Caribbean Drive
- Central Expressway
What a Storm Looks Like Here
In February 2017 Coyote Creek left its channel in San Jose and about 14,000 residents were ordered to evacuate. An independent review of the response found the sensors had been reading the whole time; the warning was what failed.
Get Alerts
Choose the creeks you care about and the threshold that matters to you, and get an email or a text when a gauge crosses it.