No travel time can be read from this window. The peaks at the top and the bottom of Coyote Creek fall a week apart, which means they belong to different storms in the same sequence rather than to one crest moving downstream.
Dec 2022–Jan 2023 atmospheric river sequence. USGS instantaneous record, 2022-12-30 to 2023-01-18, 6 of 14 requested stations returning data. Retrieved July 28, 2026 at 5:32 PM PT.
Coyote Creek Storm Replay
8 stations top to bottom, drawn on the 5 with a record in this window. Run the clock and the rise arrives at each in turn. Every column holds the last reading the gauge actually took rather than sliding between samples, so what moves on screen is the record itself.
USGS 11172175 · station 7 of 8 downstream · NOAA CMIC1
13.98 ft2,180 cfs
Peak, Jan 16, 10:15 AM PT
NOAA flood stages here: action at 14.5 ft, minor at 15.5 ft, moderate at 18 ft
COYOTE C NR ALVISO CA
USGS 372750122012701 · station 8 of 8 downstream · NOAA RYAC1
8.88 ftstage only
Peak, Jan 5, 11:00 AM PT
December 30, 2022 at 12:00 AM PT
Jump to
The peaks table below lists the same readings as text.
Coyote Creek near Gilroy peak 9,290 cfs
Coyote Creek below Coyote Reservoir NR San Martin peak 3,710 cfs
Coyote Creek at Madrone peak 450 cfs
Coyote Creek above Hwy 237 at Milpitas peak 2,180 cfs
Discharge in cubic feet per second, from the USGS instantaneous record. Every station shares one axis, so the fall from the top of the creek to the bottom is measured rather than drawn. This window is plotted at reduced resolution by taking the highest reading in each interval at its own timestamp, so no peak is lost and no plotted point is a value the gauge did not report.Where each station's highest reported reading falls inside this storm window. Position is timestamp, not estimated travel.
Coyote Creek near GilroyJan 9, 10:15 AM PT
Coyote Creek below Coyote Reservoir NR San MartinJan 16, 10:45 AM PT
Coyote Creek at MadroneJan 16, 4:15 AM PT
Coyote Creek above Hwy 237 at MilpitasJan 16, 10:15 AM PT
COYOTE C NR ALVISO CAJan 5, 11:00 AM PT
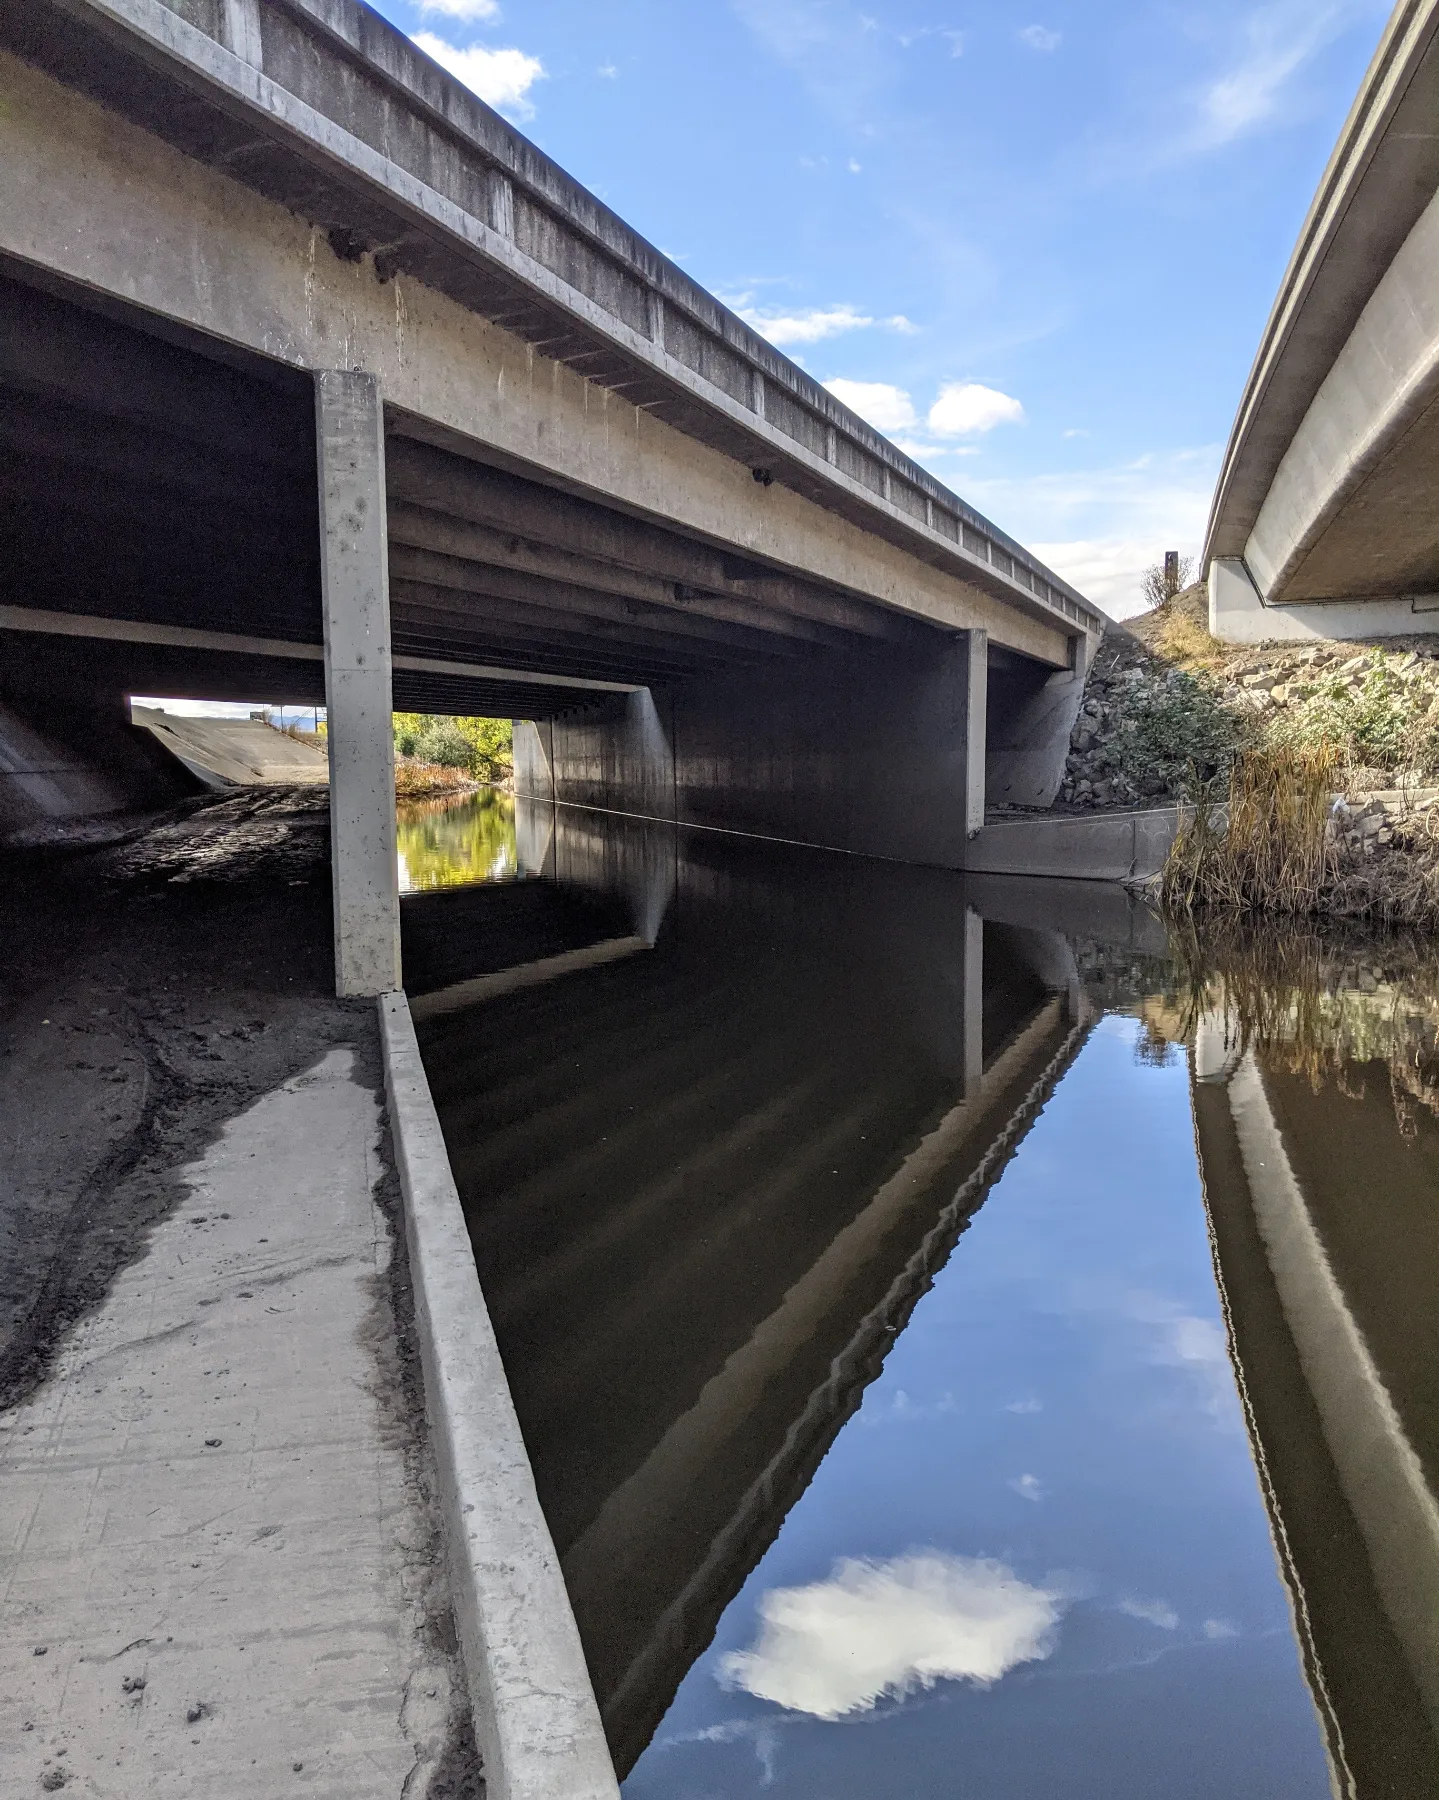
A crossing the record must serve
Coyote Creek at Highway 237
This October 2021 view is place context for one downstream Coyote Creek crossing, not an image of the January 2023 window. The replay above is the event evidence; this frame keeps its consequences tied to a real piece of flood-control infrastructure.
Coyote Creek under Highway 237, October 2021. Place context, not a January 2023 condition image. Photo: Dicklyon / CC BY-SA 4.0.
Coyote Creek, in Full
Peak flow and peak stage at each reporting station on Coyote Creek
Station
Peak flow
Reached
Peak stage
Reached
Coyote Creek near Gilroy
9,290 cfs
Jan 9, 10:15 AM PT
16.54 ft
Jan 9, 10:15 AM PT
Coyote Creek below Coyote Reservoir NR San Martin
3,710 cfs
Jan 16, 10:45 AM PT
10.74 ft
Jan 16, 10:45 AM PT
Coyote Creek at Madrone
450 cfs
Jan 16, 4:15 AM PT
3.87 ft
Jan 16, 4:15 AM PT
Coyote Creek above Hwy 237 at Milpitas
2,180 cfs
Jan 16, 10:15 AM PT
13.98 ft
Jan 16, 10:15 AM PT
COYOTE C NR ALVISO CA
not reported
not reported
8.88 ft
Jan 5, 11:00 AM PT
Peak to Peak
Each interval below is the arrival of the highest reading at that station, measured from the highest reading at Coyote Creek near Gilroy, the furthest upstream station with a record here. An interval is quoted as a travel time only when the downstream peak follows the upstream one inside 48 hours. The rest are still published, with the reason, because an unexplained negative lag could look like an error when it actually reflects a second, separate storm.
Interval from the upstream peak to each downstream peak on Coyote Creek
Station
Interval
Reading
Coyote Creek below Coyote Reservoir NR San Martin
+168.50 h
These peaks are 7.0 days apart, which is a later storm in the same window rather than the same crest arriving.
Coyote Creek at Madrone
+162.00 h
These peaks are 6.8 days apart, which is a later storm in the same window rather than the same crest arriving.
Coyote Creek above Hwy 237 at Milpitas
+168.00 h
These peaks are 7.0 days apart, which is a later storm in the same window rather than the same crest arriving.
COYOTE C NR ALVISO CA
-95.25 h
This station peaked before the upstream station did, so the two peaks are separate events.
What Is Missing, and Why
3 of the 8 stations on this reach have no reading in this window. Each carries the dates out of its own USGS site record underneath, so a reader can tell a hole in the federal network from a hole in this site without taking our word for it.
COYOTE C BL LEROY ANDERSON DAM NR MADRONE CAUSGS 11169970
The USGS site record carries no discharge or stage series for this station at all.
No discharge or stage series of any kind in the USGS site record for this station.
COYOTE C BL COYOTE RANCH RD NR COYOTE CAUSGS 11170450
The station had not been instrumented yet. Its record begins 2024-10-01.
flow, daily, 2024-10-01 to 2025-09-30 · flow, instantaneous, 2024-10-01 to 2025-10-01
COYOTE C NR EDENVALE CAUSGS 11171500
The record breaks here. Readings run to 1962-09-29 and do not resume until 2024-10-01.
flow, daily, 1916-10-01 to 1962-09-29 · flow, daily, 2024-10-01 to 2025-09-30
What NOAA Says Happens at These Levels
The National Weather Service keeps a written impact library for the gauges it forecasts, naming the parks, streets and neighborhoods that go under at each stage. These are its words, unedited.
Coyote Creek at Madrone
NOAA gauge CYTC1
Major Flooding...to CA-237. Japantown, Hyde Park, and Northside San Jose are possibly flooded.
NOAA National Water Prediction Service, impact at 14.2 feet, gauge CYTC1
Major Flooding...Neigh NW of Watson Park may be flooded. Floodwaters converge to Commerial St Neigh around N 4th St and N 10th St to cause flooding N of I-880 in San Jose. Businesses N and S of Berryessa Rd and W of thee crk are inundated. South Bay and Golden Wheel Mobile home parks inundated; risk that floodwaters could overtop and flood homes to the W. Charcot Bridge overtopping on both R and L banks flowing away from the crk flooding an area b/e Coyote Cr and Guadalupe River, and b/e Montague Expy to...
NOAA National Water Prediction Service, impact at 14.1 feet, gauge CYTC1
Major Flooding: Disastrous flooding occurs along Coyote Crk downstream of Tully to the SF Bay. Rocksprings Neigh and adj horse ranch inundated. Apt buildings at int of Keyes St and S 12th St flooded. Happy Hollow Zoo and Kelley Park flooded. Spills from Selma Park flow N to flood large area E of the crk, continuing N to Upper Penitencia Crk, overflowing Hwy 101. W Bank outbreaks at Watson Park, N 20th St, Roosevelt St, N 19th St at its S end, N 18th St, E St. John St, E Santa Clara St and S 17th St...
NOAA National Water Prediction Service, impact at 14 feet, gauge CYTC1
Coyote Creek above Hwy 237 at Milpitas
NOAA gauge CMIC1
Moderate Flooding: Watson Park inundated. Banks are overtopped at Charcot Ave with flooding along Paragon Drive. Higher flows may result in overland flows northwest of Watson Park and northeast of Charcot Ave toward Montague Expressway.
NOAA National Water Prediction Service, impact at 18 feet, gauge CMIC1
Minor Flooding: Watson Park begins to flood.
NOAA National Water Prediction Service, impact at 15.5 feet, gauge CMIC1
Action Stage.
NOAA National Water Prediction Service, impact at 14.5 feet, gauge CMIC1
Guadalupe River, in Full
Peak flow and peak stage at each reporting station on Guadalupe River
Station
Peak flow
Reached
Peak stage
Reached
Guadalupe River (CA) above Hwy 101 at San Jose
4,610 cfs
Jan 16, 7:00 AM PT
14.61 ft
Jan 16, 7:00 AM PT
What Is Missing, and Why
5 of the 6 stations on this reach have no reading in this window. Each carries the dates out of its own USGS site record underneath, so a reader can tell a hole in the federal network from a hole in this site without taking our word for it.
GUADALUPE RES A ENRIQUITA MINE NR NW ALMADN CAUSGS 371140121521701
The USGS site record carries no discharge or stage series for this station at all.
No discharge or stage series of any kind in the USGS site record for this station.
GUADALUPE RES A DAM NR NEW ALMADEN CAUSGS 371156121523901
The USGS site record carries no discharge or stage series for this station at all.
No discharge or stage series of any kind in the USGS site record for this station.
GUADALUPE C A GUADALUPE CAUSGS 11167500
The station's record ends 1959-09-29, before this window.
flow, daily, 1930-04-01 to 1959-09-29
GUADALUPE R A ALMTOS RCHG FAC AT SAN JOSE CAUSGS 11167572
The USGS site record carries no discharge or stage series for this station at all.
No discharge or stage series of any kind in the USGS site record for this station.
GUADALUPE R A SAN JOSE CAUSGS 11169000
The station's record ends 2003-04-30, before this window.
flow, daily, 1929-10-01 to 2003-04-30
What NOAA Says Happens at These Levels
The National Weather Service keeps a written impact library for the gauges it forecasts, naming the parks, streets and neighborhoods that go under at each stage. These are its words, unedited.
Guadalupe River (CA) above Hwy 101 at San Jose
NOAA gauge GSJC1
Major Flooding: Levee overtopping, with failures likely along both sides of the river between US-101 and Trimble flowing in a northerly direction.
NOAA National Water Prediction Service, impact at 21 feet, gauge GSJC1
Moderate Flooding: Levee overtopping imminent. Highest risk areas are between US-101 and Trimble.
NOAA National Water Prediction Service, impact at 20 feet, gauge GSJC1
Minor Flooding: High flows with heavy debris might cause localized blockages to cause overtopping of levees.
NOAA National Water Prediction Service, impact at 19 feet, gauge GSJC1