
Cunyan Ma is finding where the data workers are
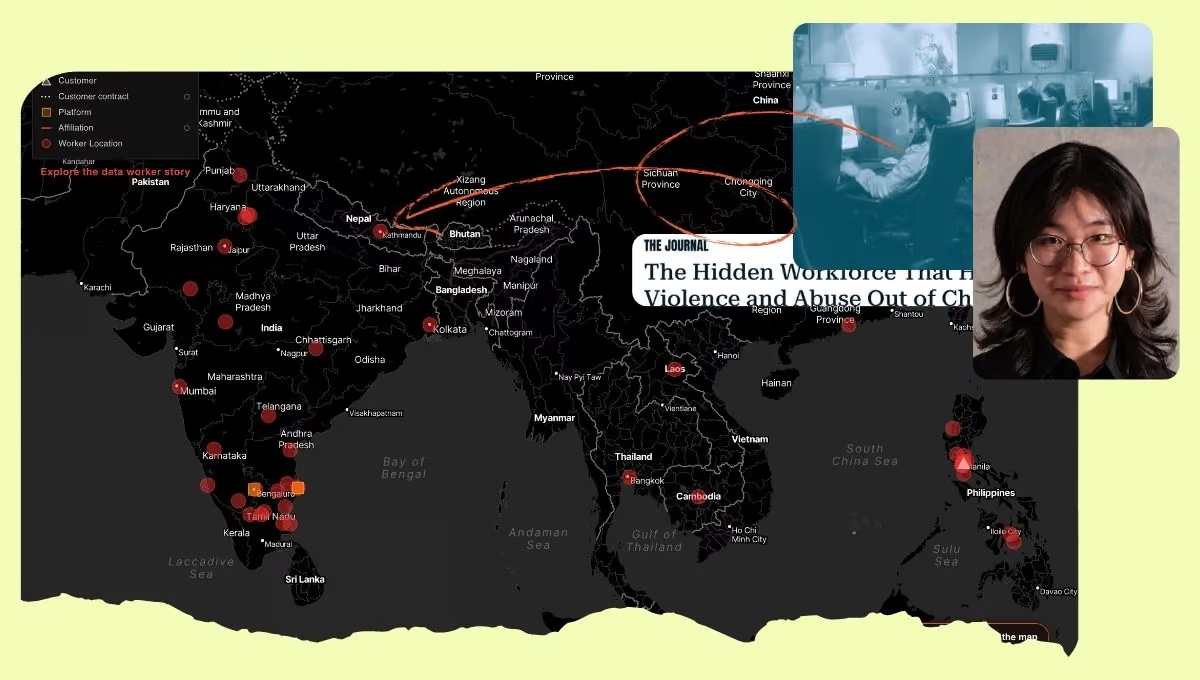
Pulling back the curtain on the global labor force that contributes to AI systems has been a challenge researchers and advocates have worked on for years. One of the main goals of TechEquity’s mapping project, Data Work Landscape, is to provide a resource that other researchers can utilize to answer additional questions about the industry.
Cunyan Ma, an undergraduate student at Brown University, did just that as part of the “Power Mapping AI’s Materiality” project with the Center for Technological Responsibility, Re-imagination, and Redesign. In “Where are the data workers behind AI?”, Cunyan uses data from the Data Work Landscape combined with original data to visualize the locations of workers involved in data work. You can learn more about Cunyan’s project through this blog post.
We talked to Cunyan about her research and what she learned. Maybe you’ll get inspiration to investigate a different angle or element of the data work landscape…
What inspired you to research the data work industry?
The motivation of the project is to visualize AI colonialism in a way that’s immediately accessible: telling a story of power and making apparent how AI systems inherit and perpetuate neoliberalism and the colonial world order. For me, the data labeling story hits right through the core. The fact that it’s an outsourcing industry with the majority of workers in the Global South, and that their contributions don’t get recognized in the narrative around AI, is something that’s very worth talking about.
The project is about collecting a dataset on data worker locations and then visualizing that. In my map, I highlight three different layers of the data labeling supply chain: the data workers themselves; the platforms that employ those workers; and the AI companies that contract with those platforms. These three layers each correspond to different nodes of power. The map is an immediate piece of storytelling about power.
How did you utilize data from the Data Work Landscape as part of your research? What other data sources did you add to create this map?
The Data Work Landscape was immensely helpful and was the foundation of this work in two major aspects.
First, TechEquity compiled a list of data labeling platforms that became my first reference in understanding the platforms that exist, alongside a systematic search of data labeling platforms from other industry and media reports. TechEquity’s database also categorizes those platforms into either a marketplace or a Business Process Outsourcing (BPO) model. The BPO category is the one that I looked into specifically.
Second, I used the Data Work Landscape’s mapping of the relationships between each platform included in their database and the documented customers of those platforms.
If you look at my map, there are three nodes: customers, platforms, and worker locations. All of the customer nodes and most platform nodes came from the Data Work Landscape.
The worker location node came from my own data collection. I wanted to find documented worker locations of data labeling platforms that operate on a BPO model. BPOs often operate from their headquarters and then have regional offices elsewhere that act as their delivery centers for data labeling. These delivery centers are sometimes publicly documented, for example on the company’s website or LinkedIn, but this disclosure is entirely up to the companies themselves.
I dug into most of the companies in the Data Work Landscape that operate BPOs, and I was able to find 13 companies that have publicly announced locations of their delivery centers, and that is what is included on the map. This is also described in my methodology.
Given the lack of transparency in this industry, what were the biggest challenges?
There is no regulation that requires companies to release any information about worker locations. The entire industry is made deliberately opaque to avoid accountability. Given the lack of organized information, there is no computational means to collect data systematically. All the data needs to be manually scraped amid a scattered information landscape.
There’s also no simple cross-verification possible. I had to take companies at face value in terms of what they state publicly about where they operate. We are looking into crowdsourcing from workers as a second way to confirm information released by the companies.
What geographic patterns emerged?
This map is not exhaustive. We currently only have 13 platforms represented so far, and so any patterns that I’m observing are based only on these platforms.
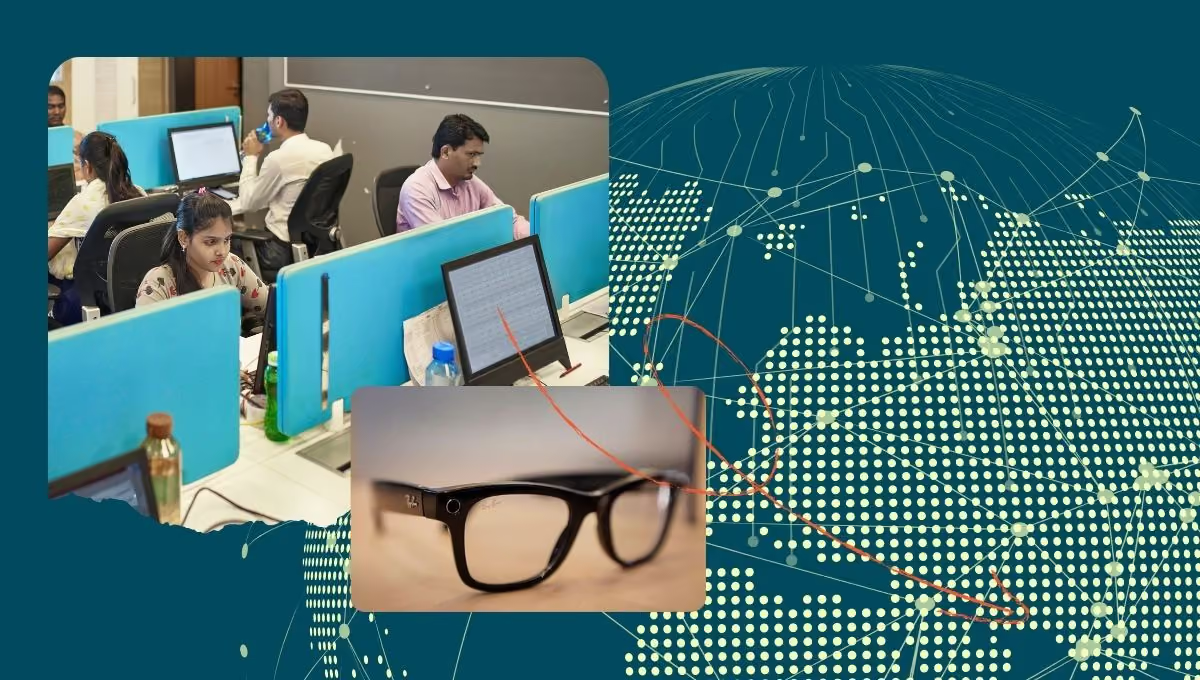
There are three patterns on the worker’s side. One is that traditional outsourcing centers, such as India and the Philippines, still have a lot more and more noticeably consistent distribution of workers. I think that has a lot to do with history: the fact that these countries were the call centers of the world and where a lot of IT work has been outsourced. The existing business structure can be easily transformed into a data labeling industry.
The second thing is that there do not seem to be as many documented sites in Africa and Latin America, despite the high-profile reporting these regions get. One reason may be that a documented delivery center in a location does not suggest how many workers are there, how much impact that center has regionally, etc. Also, the scope of what I have right now is not exhaustive. And thirdly, given Africa and Latin America’s less mature business infrastructure for IT outsourcing, it’s harder to establish business connections compared to traditional centers, though these regions are emerging as growing outsourcing hubs. I expect to see more and more data workers in Africa and Latin America in the future.
The third observation is that there are actually a lot of delivery centers in Europe. I’m still looking into why that is.
Yet there still is a pattern of delivery centers existing in the Global South, just not concentrated in one single region.
What I think is more important is that, with only a very few exceptions in Israel and Asia, almost all data platforms and customers are located in North America and Europe. The only three platform exceptions that I documented are in India and Singapore, and most of those companies also have another headquarters in the US. So the concentration of power is very, very obvious.
In addition to the map, you also highlight the stories of workers involved in this labor. What do you hope that people understand about the work that data workers do?
I think the worker stories are really what it’s all about. I was originally motivated to do this project because I read worker stories in Billy Perrigo’s reporting for TIME and from Karen Hao’s book, Empire of AI. I think people really need to learn about the actual labor, time, exploitation, and trauma that goes into creating this amorphous concept of AI technology. I built a feature called “Explore the Data Worker Story” on the map, which intends to connect the history of the AI industry, the history of outsourcing, the sociopolitics of some countries, and the stories of some data workers to this visualization. Through that, I want to highlight how these worker stories are connected across the entire industry.
What additional research questions occurred to you as you worked on this project and/or after publishing the current version of your research?
This project is part of a series called “Power Mapping AI’s Materiality,” and I hope to concretize the framework further. A “Power Map” is an organizing tool to identify the loci of power around a target, while “materiality” refers to the tangible, physical material in the production of AI, whether that be critical minerals, labor, etc.
As the AI supply chain grows into a complex, multi-tiered global network, with raw resources sourced from and labor outsourced to independent actors through opaque processes, the power distribution along each node of the supply chain becomes more hidden, and with it, leverage for organized action at different fronts. I want to dive into what power mapping AI’s material supply chain through data collection and visualizations like this can hold the structure more accountable.
I am also very curious about crowdsourcing itself as a useful research method. So much of my research has relied on the availability of information in a top-down manner. In the case of the data work industry, that clearly fails, because only a few companies publicly disclose the data. Comparatively, crowdsourcing from workers gathers an image of labor distribution from the bottom up, and the process in doing so itself organizes folks towards the same orientation. I’ve been in touch with workers and other initiatives to make this happen.
What surprised you most in this research?
Just how difficult it was to get information and how we sometimes need creative and unconventional approaches. In my methodology, I used large language models (LLMs) to help me parse information and filter the broader data work landscape. There are so many data work platforms, and I don’t have the capacity to go into each one of them and search for their local location one by one.
LLMs can sometimes provide a first-pass gauge of how much information is available about some of these companies. I asked an LLM to rate the confidence of information that can be found about different delivery centers to help prioritize my list of companies; then I would research each platform by myself and only include information verified by me in the database.
What advice do you have for researchers and workers who are exploring their own research questions about this complicated industry?
Reach out and connect! I spent the first half of this summer just working in the dark. This is such a new industry, and so many new things are happening, and the available information does not capture what is actually happening in the dark.
It really took me reaching out to TechEquity and other people to realize how many initiatives are happening and how many resources are out there. Reaching out is important for researchers and for workers.
Cunyan Ma
How would you like your work to be used? Any final thoughts you would like to share?
One vision for this project is a public education tool: I hope that when people teach about AI, they can teach it alongside the political economy that dictates AI ownership and its distribution of benefits, as well as the labor exploitation in the process. I’m reaching out to a few educators who work on critical AI literacy curricula, and I hope that it can be part of the narrative when we talk about AI.
And the second vision is for it to be an organizing tool. I hope that it can actually empower folks not only to learn about the industry, but also to hold it accountable, and that cannot be done outside of workers themselves. Tech companies don’t just rely on software engineers, but also on this vast outsourcing network. Mapping may help inform workers about their leverage and power at different nodes in the industry.
And finally, problems with technology don’t just involve technical systems; it has to do with how technical systems are organized politically, and hence demand political solutions. I hope that by drawing the parallel between the distribution of labor in the data labeling industry and the colonial system, we can elucidate that.
What You Can Do
Want to learn more about the global AI supply chain?
Explore the Data Work LandscapeResearchers can also access more information about the methodology behind the Data Work Landscape and download the data here. The data on the site is free to use for non-commercial educational purposes.