Plan · Transportation
Regional Transportation Plan (Updated 2024)
All 11 counties

The text of this plan
Contents Chapter 1 5 Introduction 5 The Green Hills Regional Transportation Advisory Committee (TAC) 6 Long-Range Transportation Plan (LRTP) and the Statewide Transportation Improvement Plan (STIP) 7 Needs Identification 8 Study Organization 9 Study Area 10 Goal #1 11 Goal #2 11 Goal #3 12 Goal #4 12 Goal #5 13 Chapter 2 14 Multi-Modal Transportation Advisory Subcommittee 14 Multi-Modal Subcommittee 14 Name 14 Mode 14 Beth Langley (Chair) 14 Transit 14 Oats Transportation 14 Bud Motsinger 14 Bike/Ped. 14 Little Otter Creek Reservoir 14 Ron Urton 14 Aviation 14 Trenton Municipal Airport 14 Jeffery Martin 14 Rail 14 Amtrak Stop for Carrollton 14 Ron Reckrodt 14 Aviation 14 Unionville Municipal Airport 14 Bradley Scott 14 Bike/Ped. 14 Roy Blunt Lake Reservoir 14 Regional Overview: Land Use and Census Data 15 Transportation Land Use 15 Agricultural Resources and Land Use 16 Industrial Land Use 16 Commercial Land Use 17 Natural/Environmental Resources and Land Use National Wildlife Refuges 17 State Parks 17 Conservation areas 18 Nationwide inventory Rivers 19 Environmental Corridors 19 The Locust Creek Environmental Corridor 20 State and Federal Threatened or Endangered species 22 Water Resources 23 Power Utilities 26 Electric Utility Services Areas in the Green Hills Region 27 Employment 28 Median Household Incomes 29 Additional Groups 30 Sharing the road safely with the Amish Community 31 Chapter 4 32 Existing Multi-Modal Assets 33 Railroads 33 Airports 33 Bike and Pedestrian Facilities 33 Ports and Waterways 33 Chapter 5 34 National Traffic Control Standards 34 Highway Standards 34 Street Standards 36 Transportation System Management 37 Congestion Management 38 Access Management 39 Right of Way and Corridor Preservation 40 Transportation Demand Management 41 Transportation Demand Management Strategies include: 42 Energy Conservation 43 Chapter 6 45 Needs Assessment and Prioritization 45 Chapter 7 47 Caldwell County 47 Carroll County 48 Chariton County 48 Daviess County 48 Grundy 49 Harrison 49 Linn 49 Livingston 49 Mercer 50 Putnam 50 Sullivan 51 VARIOUS 51 High Priority Unfunded Needs of the Green Hills Region 51 Tier I - None 51 Tier II 51 Chapter 8 53 Transportation FundingAn Overview 53 Federal Revenue 55 State 55 Other 56 Expenditures 57 Total Expenditures 58 Construction Program 59 Missouri Transportation Funding 59 Funding Distribution 60 Federal Funding 61 Advance Construction (AC) 63 Chapter 9 64 Plan Implementation 64 Safety 64 Taking Care of Our System 64 Major Projects and Emerging Needs 65 Interstates and Major Bridges 65 Local Transportation Management Tools 65 Adoption of the Green Hills Regional Transportation Plan 66
Chapter 1
Introduction
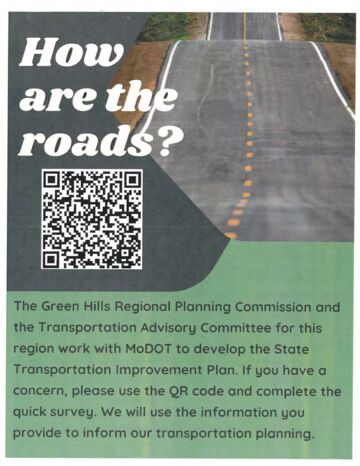
We – as residents of Missouri and as the Green Hills Regional Planning Commission working on behalf of our local governments – now have a real and meaningful role to play In Transportation Planning. The development and implementation of the Missouri Department of Transportation’s Planning Framework has made us a partner at the decision-making table. As we work in partnership with the Missouri Department of Transportation, we now have the opportunity to offer new and different viewpoints that can be brought to bear on transportation decisions; as local users of the system, we are able to offer unique perspectives previously missing from the process. With this opportunity also comes responsibility. As a partner in the decision-making process, we will also share the responsibility of the outcome. We must represent the views of our local elected officials and their constituents and bring to the forefront information that is necessary for those officials, TAC Board Members, and staff to make sound, prudent, and defendable recommendations. To date, the Regional Planning Commission– through its’ partnership with the Missouri Department of Transportation – has been focusing on the State. Highway System and prioritizing those needs and projects. That work will continue, but to better serve all transportation customers, this emphasis will be expanded to consider all modes of transportation and all systems, including those owned and maintained by counties and municipalities. It is important to consider how the different systems work together, now and in the future. The Missouri Department of Transportation, through this effort, is providing system management data and mapping information to the Planning Commission. The intent is for the Planning Commission to analyze this information from a regional perspective, develop different scenarios using the data that may generate new information, consider issues that may have been overlooked in the past and consider local perspectives when deciding what information to analyze. It is the prerogative of the Planning Commission, through its TAC board, to involve local officials throughout the region in determining what information is needed, and what type of analysis will facilitate the best recommendations for the region. The Green Hills Regional Transportation Advisory Committee (TAC) The Missouri Department of Transportation long ago realized the importance of local input in statewide transportation planningespecially in determining which transportation needs and values are most important to the Region and the State. The Department chose Regional Planning Commissions to obtain this local input because they geographically covered the state, were knowledgeable about planning activities, had experience working with federal programs, and had the desire to be involved in the transportation planning process. The initial activities began in 1993.
Each Regional Planning Commission (RPC) was required to appoint a Regional Transportation Advisory Committee (TAC) composed of local officials and citizens, to gather general transportation comments and work actively with MoDOT. The success of the initial phase led to the expansion of the RPC planning activities in 1995. The expanded process directed each RPC to develop an annual transportation work program that identified specific transportation planning activities that they would conduct for the department. The additional items included an evaluation process of transportation needs, a public involvement process, development of regional data, and professional staff development. The program was successful in providing transportation information for use in MoDOT’s decision making process. The program has continued through the years to assist with updates to the LRTP and the selection of projects to meet the transportation goals outlined in it. Long-Range Transportation Plan (LRTP) and the Statewide Transportation Improvement Plan (STIP) The Missouri Department of Transportation (MoDOT) continuously develops and refines Missouri’s ‘transportation vision’ the ideal transportation system for the State. Missouri cannot afford all the components of this ideal system, so the LRTP defines Missouri’s priorities and identifies strategies for addressing the priorities with available funding. The priorities addressed become part of the STIP, a document prepared annually that sets forth the specific construction projects MoDOT will undertake in the following five years. It covers highways and enhancements and other projects. MoDOT does not make these decisions on their own. Through the Regional Planning Commissions (RPC), MoDOT works to develop the regional transportation needs, outline long-term goals, and build informed consent among Missourians regarding Missouri’s transportation vision and the best way to achieve it. Taking part in this planning collaboration, working on behalf of our local governments, the privilege of playing a real and meaningful role in the transportation planning process with this opportunity also comes responsibility. As a partner in the decision-making process, we will also share the responsibility for the outcome. We must represent the view or our local elected officials and their constituents and bring to the forefront information that is necessary for those officials, TAC Board members, and staff to make sound, prudent, and defendable recommendations. MoDOT provides system management data and mapping information to the Planning Commission which analyzes it from a local and regional perspective, generating new information and considering issues that may have been overlooked in the past. The RPC does this through its Transportation Advisory Committee, (TAC) board, involving local officials throughout the region in determining what information is needed, and what type of analysis will facilitate the best recommendations for the region. As we have
worked in partnership with the Missouri Department of Transportation, we’ve had the opportunity to bring new different viewpoints to bear on transportation decisions; as local users of the system, we are able to offer unique perspectives previously missing from the process. The TAC members were instructed to speak with their constituents within their counties to collect needs within the communities. Members were encouraged to talk with citizens that utilize the region’s transportation system regularly which included bus drivers, overthe-road truck drivers, farmers, patrolmen and several others. Needs were also collected through individual public meetings with each county commission. Once all needs are collected, the TAC board prioritizes them. The needs and projects that are addressed in this plan are the opinions of the current TAC members, elected officials, and members of the public residing within the region. Other sources utilized to complete this plan include the US Census Bureau, Office of Social and Economic Data Analysis, the Missouri Department of Natural Resources and Environmental Systems. Needs Identification Identifying Missouri’s transportation needs is a continuous process and crucial for successful planning. There are two levels of needs identification. • RegionalThese needs are identified on a continuous basis at the district level. • StatewideThese needs are identified every three to five years with the LRTP update. Needs are categorized in two ways: • Physical needs relate to the condition of pavements and bridges. • Functional needs relate to operational aspects of the transportation system. MoDOT districts work with planning partners to prioritize regional needs on an annual basis. Statewide needs are prioritized when MoDOT’s long-range transportation plan is updated. High priority needs are fiscally constrained to about ten years of funding and are not a commitment to design or construct projects. Each time needs are prioritized existing needs are reevaluated. Some high priority needs may never be designed or constructed due to prohibitive costs, changing priorities of other reasons. To date, the RPC, through its’ partnership with MoDOT, has been focusing on the State Highway System and prioritizing those needs and projects. That work will continue, but
to better serve all transportation customers, this emphasis will be expanded to consider all modes of transportation and all systems, including those owned and maintained by counties and municipalities. It is important to consider how the different systems work together, now and in the future. Study Organization The Green Hills RPC is one of nineteen sister offices operating as part of the Missouri Association of Councils of Government (MACOG)- An organization of sub-state planning and development agencies serving the State of Missouri. The Commission is organized as a voluntary association of local governments whose duty elected board meets monthly and has retained a staff of professionals who work on project intended to foster improved quality of life throughout all communities within the 11 county “Green Hills” region. In this mission, the Green Hills RPC addresses a broad cross-section of issues, including comprehensive planning; economic development, marketing, industrial park development, operation of revolving loan funds, and coordination with industrial prospects and various agencies and organizations involved in economic development. The prime role of the GHRPC is to provide a technical staff capable of providing sound advice to its membership and the coordination of various planning and infrastructural needs among the various counties and municipalities, as appropriate, providing an effective way for local governments to work together to address common problems and to share technical staff for problems that cross border lines or boundaries and need an area wide approach. The Commission also can effectively deliver programs which cannot be afforded on a collective basis where all share staff and/or resources. In 1993 the Missouri Department of Transportation chose to employ the RPC in gathering local input for their statewide transportation planning efforts. Initially the RPC were required to appoint a Regional Transportation Advisory Committee (TAC) composed of local officials and citizens, to gather general transportation comments and work actively with MoDOT. The success of the initial phase led to the expansion of the RPC planning activities in 1995. The expanded process directed each RPC to develop an annual transportation work program that identified specific transportation planning activities that they would conduct for the department. The additional items included an evaluation process of transportation needs, a public involvement process, development of regional data, and professional staff development. The program was successful in providing transportation information for use in MoDOT’s decision making process and has continued through the years to assist with updates to the LRTP and the selection of projects to meet the transportation goals outlined in it.
Study Area The Green Hills Region of north-central Missouri composed of Caldwell, Carroll, Chariton, Daviess, Grundy, Harrison, Linn, Livingston, Mercer, Putnam, and Sullivan counties. Geographically, the region is largely uniform and is predominated by rolling uplands and stream valleys, through in the southernmost counties there are wide stretches of flood plain. There are several US highways and one major interstate passing through the region, and many hundreds of miles of state-maintained asphalt roadways and bridges. There are no major airports, but a number of small private and public access runways, and there are several major railways in the region. There is one river port located in Chariton County alongside the Missouri River.
Transportation Advisory Committee (TAC)
County County Representative City Representative Citizen-At-Large Caldwell Dale Akey (Presiding Commissioner) Vacant Bud Motsinger Carroll Stan Falke (Presiding Commissioner) Susan Bliss Jeffrey Martin Chariton Evan Emmerich (Presiding Commissioner) Steve Kacvinsky Gabriel Reichert Daviess Wayne Uthe (Associate Commissioner) Vacant Carl Carder (TAC Chair) Grundy Phillip Ray (Presiding Commissioner) Ron Urton Vacant Harrison Jack Hodge (Presiding Commissioner) Jake Taylor Vacant Linn Josh Muck (Associate Commissioner) Dana Tarpening Richard Switzer Livingston Ed Douglas (Presiding Commissioner) Jeff Gillespie Vacant Mercer Jerry Allen (Presiding Commissioner) Tracy Meinecke Lori Porter Putnam Robert Munden (Presiding Commissioner) Gary Davis Clint Stobbe Sullivan Chris May (Presiding Commissioner) Crystal Bupp Danah Fowler
Goals and Objectives
The following goals and objectives will be used during phase one of the Green Hills Regional Planning Commissions’ Regional Transportation Plan (RTP) as a guide in planning, researching and compilation of the finished document. The members of the Transportation Advisory Committee (TAC) reviewed, amended, and adopted this set of goals and objectives at the start of the project in June of 2005. It is expected that these goals will be redeveloped and/or amended as the plan progresses to reflect current priorities for the region. Goal #1 Plan, develop, and maintain a more resilient multi-modal transportation system that benefits all residents and commuters within the eleven-county region. Objectives: • Improve existing infrastructure and build more resilient infrastructure as needed. • Maintain current transportation systems. • Make the transportation system accessible to all residents. • Account for freight movement on surface transportation systems and adjust to fit traffic patterns. • Continue to research the feasibility of a rural public transportation system within the eleven-county area.
Goal #2 Promote a safe and reliable, resilient transportation system in the Green Hills Region of Missouri. Objectives: • Reduce traffic crashes. • Provide for quick emergency response in the event of accidents. • Encourage communities to define needs and strategies for a safer, more resilient transportation system. • Develop pedestrian friendly communities and roadways, as well as work to build more resilient sidewalks. • Encourage law enforcement agencies to increase enforcement along high traffic corridors, reinforcing speed and seat belt laws.
• Expand and maintain proper signage and visibility on roadways, including speed limits signs, horizontal curve signs, proper lighting, etc. • Create awareness for traffic safety through partnerships with local school districts, public health agencies and law enforcement. Goal #3 Develop a transportation system that enhances the quality of life for the communities within the eleven counties and promote economic development across the region. Objectives: • Improve the effectiveness of the region’s transportation system, providing convenient modes of transportation of goods and services. • Maintain a transportation system that minimizes the impact to a community’s integrity and is sensitive to local businesses. • Utilize current and future land use plans in transportation decisions and projects. • Preserve, whenever possible, agricultural and forested lands. • Ensure communities are knowledgeable of all the resources for public transportation improvements and additions. • Improve the ability to communicate with transportation users. Goal #4 Provide a planning process which is open to public comment, credible, and complies with state regulations. Objections: • Utilize citizen input in the planning of the transportation system’s maintenance and new projects. • Rationalize on a regional level when planning and preparing for new projects throughout the region and state. • Educate the public on the inner workings of the region’s transportation systems, including projects, travel trends, and safety.
Goal #5
Promote and encourage resiliency in the transportation planning process to better prepare for the future and reduce the impact of natural or manmade disasters.
Objectives: • Encourage development of a transportation system, which can safely and efficiently accommodate unusual and unpredictable conditions. • ‘Promote transportation improvements, facility design and construction standards that withstand extreme demands and unexpected conditions.
Chapter 2
Multi-Modal Transportation Advisory Subcommittee
In FY 2024-2025 The Green Hills Regional Planning Commission, in partnership with MoDOT, began planning efforts that would address the specific multimodal assets in the region and provide a framework for planning and prioritizing future projects in the region. This was accomplished by forming a multi-modal subcommittee that will meet at least twice annually and provide recommendations to TAC regarding prioritizing these projects. These planning efforts will provide information about projects in the region and advance the region’s efforts to expand multi-modal assets with a focus on economic development in the region.
Multi-Modal Subcommittee
Name Mode
Beth Langley (Chair) Transit Oats Transportation Bud Motsinger Bike/Ped. Little Otter Creek Reservoir Ron Urton Aviation Trenton Municipal Airport Jeffery Martin Rail Amtrak Stop for Carrollton Ron Reckrodt Aviation Unionville Municipal Airport Bradley Scott Bike/Ped. Roy Blunt Lake Reservoir
The function of this subcommittee is to bring individuals with knowledge of the different categories of multi-modal transportation together. Their function is to provide recommendations to the TAC for what should be a priority of the region. The TAC will then decide what should be considered the priorities of the region. This collaborative effort will allow regional voices to determine what benefits the Green Hills area the most.
The Green Hills Multi-Modal Subcommittee has identified the following priorities for the Fiscal Year 24-25, that are not currently included in the Northwest District’s Multi-Modal Unfunded Needs List.
Priority #1: The Unionville Municipal Airport (Estimated cost $6.95 million)
Priority #2: Funding a feasibility study for raising the low bridge over Highway 13
Priority #3: Development of plans for Bike/Pedestrian Trails at Roy Blunt Reservoir and Little Otter Creek Reservoir
Chapter 3 Regional Overview: Land Use and Census Data
Geography
The Green Hills Region of Missouri is a 6,420 square mile area encompassing counties (Caldwell, Chariton, Daviess, Harrison, Grundy, Linn, Livingston, Mercer, Putnam, and Sullivan) and 74 cities in north central Missouri. The region borders Iowa to the north and the Missouri River to the south. (See regional map). Considered part of the interior plains’ central lowlands, the topography is largely uniform, predominated by rolling uplands and stream valleys, the exception being the southernmost counties where the flat Missouri River bottoms make up a significant portion of their land area. Transportation Land Use There are several US highways and one major interstate passing through the region, and many hundreds of miles of state-maintained asphalt roadways and bridges. There are no major airports, but several small private and public access runways, and there are several major railways in the region. There are several minor ports in the counties which border the Missouri River. The Green Hills Region has many miles of state-maintained roadwaytwo interstate highways and about a dozen state highways, with a great number of littered highways, in varying conditions. One American Legion Memorial Highway (65) runs through the region and is the focus of a concerted effort along its length throughout the Missouri to upgrade it to four lanes. There is one VFW Memorial Highway (36) which bisects the region from east to west, a major traffic way that runs the width of the state from the Missouri River in the west and to the Mississippi River on the east side of Missouri and is four lane for most of its length. Part of the Lewis and Clark Trail also runs through the southern part of the region, along highway 10, 24, and 5 in Carroll and Chariton counties. Railroads first made their way across the region in the late 1850’s with the construction of the Hannibal and St. Joseph railroad. After the end of the Civil War, the sale of surplus railroad land was intensely advertised and resulted in increased immigration of easterners to the region. In 1887, the Milwaukee railroad crossed the southern counties of the region. There were as many as seven different railroad companies traversing the region, but today there are three left operating the remaining functional track, which all run southeast to northwest. Burlington Northern has two lines running through Carroll, Chariton, and Linn Counties. Norfolk and Western has a line running through Caldwell, Livingston, Sullivan, and Putnam, and Union Pacific runs though Caldwell, Grundy, and Mercer. There are 18 airports, mostly of which are private and commercial use only. (There are no “major” airports in the region) Most of these are easily capable of receiving helicopter traffic as well. There are four dedicated heliports in the region, all private, at hospitals for medical transport. There are three ports; all located along the Missouri River in Carroll or Chariton Counties. Being mostly rural, bicycle and pedestrian paths are limited in the Green Hills Region. Most communities with a school have a football field and a track where people go to walk or run, but most of those discourage or outright disallow biking. Some communities, like Trenton and Chillicothe, have fair sized park systems with allow them space for walking paths, but most are not designed for bicycling. Agricultural Resources and Land Use According to the Census of Agriculture farming involves 66% of the state’s land use. The state also ranks extremely high in farm exports and in the value of agricultural products sold. This multi-billion-dollar agriculture industry is a key component of the Missouri economy. The Green Hills Region itself is heavily agriculture based and reflects the importance of agriculture statewide. Farmland is divided into three categories by the US Department of Agriculture. Prime Farmland, Unique Farmland, and Farmland of statewide importance. Prime farmland is land that has the best combination of physical and chemical characteristics for producing food, feed, forage, fiber, and oilseed crops and is also available for these uses. It has the soil quality, growing season, and moisture supply needed to produce economically sustained high yields of crops treated and managed according to acceptable farming methods, including water management. Unique farmland is farmland used to produce specific high value food of fiber crops, due to its special combination of soil quality, location, growing season, and moisture supply required suited to very specific crops. Farmland of statewide importance is land that is not classified as prime of unique farmland but is nonetheless highly productive.
Source: 2022 US Census of Agriculture
Industrial Land Use In the Green Hills Region, commercial and industrial land use is overwhelmingly confined within the incorporated limits of its large communities, except for agriculturally related operations such as fertilizer and fuel plants. Commercial Land Use Commercial land use, like industrial, is primarily found inside the incorporated limits of the region’s towns. The larger towns (Chillicothe, Trenton, Brookfield, and Bethany) typically have more commercial land use, with one obvious exception being the city of Jamesport, which is a focal point for tourism in the region based around the largest Amish community in Missouri. The Amish and their products draw in tourists and the non-Amish residents offer a wide range of goods and services catering to those tourists, from antique shops to bed-and-breakfast establishments. The city of Chillicothe serves as the region’s commercial hub. Located at the junction of Hwy 36 and Hwy 65, Chillicothe possesses more retail development than any other community in the region. It is often a shopping destination for the residents of surrounding counties and has additional draw with entertainment-oriented development such as the large theater and bowling alley, restaurants, and bars.
Natural/Environmental Resources and Land Use National Wildlife Refuges A national wildlife refuge is a protected area of the United States managed by the US Fish and Wildlife Service. The National wildlife refuge system is a network of lands and waters managed to protect wildlife and wildlife habitat consisting of over 500 refuges, located in Northwest Chariton County. This area, along with nearby conservation areas and privately owned land delineated as wetlands, forms an environmental corridor.
State Parks A state park is an area of land preserved on account of its natural beauty, historic interest, recreation, among other reasons. State parks are similar to national parks, but under state rather than federal administration. In general, state parks are under the jurisdiction of the Missouri Department of Natural Resources. There are a number of state parks in the Green Hills Region.
Conservation areas A conservation area is a tract of land that has been awarded protected status in order to ensure that natural features, cultural heritage, and biodiversity are safeguarded. A conservation area may be a nature reserve, fish hatchery, forestry, or wildlife area, land reclamation project, or river access. Unlike state parks, conservation areas are under the jurisdiction of the Missouri Department of Conservation. There are many more conservation areas in the Green Hills Region than there are state parks ranging from large conservation areas where public hunting and fishing is allowed, to wildlife preserves that are home to populations of species of concern like herons and river otters. Many are access points to Missouri creeks and streams, which are always of concern.
Nationwide inventory Rivers The Nationwide Rivers inventory (NRI) is a listing of more than 3,400 free-flowing river segments in the United States that are believed to possess one or more “outstandingly remarkable” natural or cultural value judged to be of more than local or regional significance. There are two NRI listed rivers in the Green Hills Region: Locust Creek and Marrowbone Creek. Locust creek has been described as “one of the last un-channelized, undisturbed landform features in northern Missouri; high recreation potential, especially in and near Pershing State Park,” and notable for the “historic covered bridge; one of the best examples of aquatic community types in region.” Marrowbone Creek is recognized as “highly scenic for its limestone outcroppings and riffle pool arrangements” and is also known for unique fish types.
Environmental Corridors Environmental corridors are areas containing especially high value natural, scenic, historic, scientific, and recreational features. In North Central Missouri they generally lie along major stream valleys and around lakes. They generally contain the best remaining woodlands and wetlands, wildlife habitats, undeveloped bank lines and flood lands. An environmental corridor consists of lakes, streams, wetlands, and woodlands linked by corridors of concentrated natural resources and are part of a larger functioning system. Native wildlife and vegetation, natural drainage, and even clean water are all dependent upon environmental corridors and the vital functions they perform. In addition to the environmental benefits, recreational use is desirable for hunting and fishing, camping, hiking, biking, and tourism. Due to the recreational appeal of these areas, they are often an economic resource.
The Locust Creek Environmental Corridor Described briefly in the preceding pages, the Locust Creek Environmental Corridor is the single largest expanse of protected natural habitat and interconnected wetland area in the region. Essentially, this area is named for Locust Creek, which runs through the entire region from north to south, more specifically the small portion south of Highway 36 which is listed on the National Rivers Inventory. This creek is part of a riparian corridor that connects many natural areas (the two largest being Swan Lake National Wildlife Refuge and Pershing State Park), consisting of hundreds of acres of state wildlife areas and river access points as well as privately owned wetlands. The corridor also encompasses two high profile historic sites: The Locust Creek cover bridge and the boyhood home of General John J. Pershing.
---•rl·Ynt-L-oi AOA,. ,, .P.c.l.'II.C.:.T … s .._.a..e,. ""'r;•,o.u.,,f.,... A.Q.A,1.t..,1.1_-,, ,... 6. eu.---,w,s- ---- N 1*1,-.,--. - w . 11f)_, …
East Locust Creek Watershed M'-'tipfe-Purpose Reservoir andReaeational Facilities Map
Sullivan County, Missouri
A United States Department of Agriculture Natural Resources Conservation Service Se,a.l.1,:,3.5.,0.00
State and Federal Threatened or Endangered species
The Green Hills Region is home to a plethora of wildlife, and not just a few species of concern. The previous figure contains a comprehensive list, including both animal and plant species of concern. Source: USFWS 2019
Water Resources The Green Hills Region of Missouri lies in the glaciated plains of the central lowland’s physiographic province. North central Missouri is drained directly and indirectly by the Missouri and Upper Mississippi Rivers. Within these two watersheds, smaller streams and rivers provide drainage. All or part of the following river basins are in the Green Hills Region: the Grand, Thompson, Chariton, and Little /Chariton Rivers, plus Shoal, Medicine, Locust, and Yellow Creeks. The glacial till is constantly being dissected by runoff and this erosion is gradually destroying the level plains-like topography. The resulting drainage pattern consists of nearly parallel streams trending south of southeasterly. The flow characteristics of most rivers in this region are similar. Groundwater inflow into streams is generally low, and flow in the streams is very low or nonexistent during times of extended drought conditions. Minimal storage of water in stream banks combined with a lack of sustained stream flow leads watersheds to respond somewhat rapidly to storm events. Flash runoff following heavy rainfall events often causes excessive sediment loading in the area’s streams. Pesticides found in runoff from agricultural fields may have impacts as well. Although it depends on use, overall water quality is generally good. Most of the towns in the region depend upon surface water for public water supply and either use an intake in a river or draw water from a reservoir.
In the eastern half of the region groundwater resources are generally poor due to inadequate quantity and marginal quality, although shallow domestic wells into the glacial till generally yield enough fair quality water for household use. In the western half of the region, groundwater resources are generally better. Properly constructed wells producing from favorable locations can produce several hundred gallons of water per minute and are locally used for irrigation as well as public water supply. Thick alluvial deposits underlying the floodplains of the major rivers are a significant source of water for agriculture and well as public water supply. Yields of 2,000 gallons of water per minute or more are possible from properly constructed wells in favorable areas of the Missouri River alluvium in the southern reaches of the region. Alluvial deposits along lesser streams elsewhere in the region generally yield substantially less water. In any case, groundwater quality differs dramatically across the area and at depth and is dependent upon the geologic characteristics of the bedrock aquifer, such as the composition of glacial material. Generally, the deeper the aquifer is, the more mineralized its water. Sulfate, chloride, sodium, iron, and manganese are all constituents that can have impact on water quality in the region. In 2010 the Missouri Department’s Drinking Water Branch joined the US Geological Survey in creating a drought study assessment on all the major surface water sources in the state to ensure adequate information was made available for planning and development. This document was updated in July. The reports cited communities that would experience difficulties in sustaining water supplies during prolonged droughtsdifficulties which were extremely pronounced in the droughts of 2012-2013 and 2018-2019. Most of these at-risk communities were in the northwestern and north central regions of the state, communities which are groundwater poor and reliant on surface water supplies. Of the forty lake systems analyzed, 14 were in the Green Hills region, as was one of the four stream systems described in the report. Several of the water systems in the region collect water from more than one source, and in fact most cities have two sources of surface water, typically a reservoir or lake (of more than one) filled and kept level by precipitation, and a flowing stream. This has come to pass primarily because most of these lakes are too small in capacity and drainage area to satisfy local needs, and they must be supplemented by other sources, typically by pumping from flowing streams during high flow to keep the lake levels elevated. During drought conditions, the water flow in these streams can dwindle beyond levels that allow pumping, leaving communities to rely on reservoirs that didn’t contain sufficient water for their needs even at the best of times. This has been referred to as “The water problem” of north Missouri in general, and certain counties of the Green Hills Region in particular. Over the years various emergency connection lines have been installed enabling communities in dire straits to supplement their water supply by purchasing finished water from neighboring communities of water supply districts (see map, next page). In this same time period, DNR’s policy has been to espouse centralization of the drinking water supply network, moving away from the past model of each community having its own ray water supply and drinking water treatment plant and encouraging small communities to abandon their antiquated systems and instead turn their water funds towards purchasing finished drinking water from larger communities or water districts, where pooled funding from multiple communities can be better leveraged for the maintenance and upgrading of the system to meet ever increasing demand and water quality standards. While this accomplished some improvement in conditions during drought events, water shortages remain a possibility. The Green Hills Region has seventy-two water districts that get their water from wells, rivers, and reservoir lakes. To this end, Sullivan and Caldwell are constructing large “recreational" lakes to use for drinking water reservoirs. These two lakes in conjunction with increasing regional centralization of the drinking water supply system, make a great step towards mitigation the historical “water problem” that has affected parts of the region. Within its 6,420 square miles of land area, the Green Hills region encompasses fiftyfour communities with a population less than five thousand served by a public sewer system, providing wastewater service to approximately 42,435 residents. Out of those fifty-four communities, forty-nine are served by lagoons; three are served by activated sludge: one is served by oxidation ditch and one with package treatment plant. There are five 8-digit hydrologic unit code watersheds in this region that contain the 303(d) listed impaired streams. The reported capacity of treatment facilities in the region for these fifty-four communities combined is 10.2 million gallons per day. Five communities did not have the required capacity (100 gallons/persons/day). In 20 years, it is estimated that fourteen communities in the region will have system capacities less than the required capacity (100 gallons/persons/day). There are eight communities with collection systems graded by MoDNR as being in “excellent” condition, and one in “poor” condition. Thirty-two were rated as “good” and nine were considered “fair”. Water entering sanitary sewers from inappropriate connections is inflow, whereas infiltration is the groundwater that enters sanitary sewers through defective pipe joints and broken pipes. Inflow and infiltration issues in a facility’s collection system are costly for a wastewater treatment facility. There are twenty communities in the region that have such issues and that have a program in place. Twenty-three communities in the region have similar issues by having no program in place, and ten communities have no such issues. A schedule of compliance includes a series of required steps and deadlines to meet an operating permit’s water quality-based effluent limits, a summary of findings related to violations observed, regulatory compliance including any unsatisfactory features, the presentation of formal notices, the need for immediate remedial actions, the schedule for expected changes of improvements and other requirements or recommendations. These are issued by the DNR WPCB. Twenty-eight communities in the region have a schedule of compliance included in their operating permits. These compliance issues include pending inflow/infiltration reports, engineering plans, operation and maintenance reports, and wet testing. A notice of violation is a formal, written notification of significant noncompliance and is sent with a cover letter. These are issued by the DNR WPCB. The notice of violation is unsure for violations of law, regulations, permits, certifications, licenses of registrations that warrant legal action if not corrected. Eleven communities in the region have notices of violation. The notices are related to permit limitations, reporting violations, and sanitary sewer overflows. The region wide median rate for wastewater is $45.49 per month whereas: the statewide median rate is $21.80. Out of fifty-four communities, twenty-nine communities in the region have wastewater rates greater than statewide values. There are twenty-two communities with rates greater than the region wide median value. Two percent median household income is considered as a target rate for the state agencies to provide grants and is considered as part of the analysis to determine how many communities have reached the target rate. In the region, there are nine communities with residential rates greater than the 2% NHI rate. The total amount to address all the needs in the region is estimated to be more than S21.4 million. This accounts for 12.5 % of the statewide needs. The estimated cost to take care of system upgrades and secondary wastewater systems is $19.3 million; estimated cost for replacing and rehabbing sewer totals $1.6 million; and estimated cost for advanced wastewater treatment is $466,020.
The previous information, taken from the 604 B statewide wastewater assessments, reflects only municipal wastewater systems. Due to the county’s large rural residential population, single unit wastewater systems are ubiquitous outside the boundaries of incorporated communities. Unfortunately, detailed records of those systems do not exist, and it must suffice to say that there are many septic and lagoon systems in the county, ranging in age and condition. Power Utilities There are three rural electric cooperatives operating in the region, as well as one large metropolitan power company, KCP&L. Power distribution is both vital and highly vulnerable to disruption by both manmade and natural events. However, electrical infrastructure, like that of other utilities, is the domain of private concerns and so are not subject to local, state, and government planning controls. However, it’s imperative that local governments are aware of the utility company’s activities and maintain a working relationship for land use planning and disaster response.
Electric Utility Services Areas in the Green Hills Region
Population
The combined population of the region as of the 2022 American Community Survey was 91,784 persons. The population is distributed evenly throughout the region, with slightly higher densities along interstate 65, State Highway 6, and especially US Highway 36, the region’s only four lane highway, which bisects the southern part of the region east to west, passing through Caldwell, Livingston, and Linn counties.
Table 1 Population of Green Hills Region by County County Population Caldwell 8,876 Carroll 8,513 Chariton 7,417 Daviess 8,418 Grundy 9,878 Harrison 8,190 Linn 11,892 Livingston 14,402 Mercer 3,517 Putnam 4,698 Sullivan 5,983 Source: 2022 ACS, Census Bureau
Employment According to the FRED Economic Data in April, unemployment in the Green Hills varies from 3.4 percent in Livingston to 4.6 percent in Linn County, Missouri. Overall, the Green Hills Region experienced an average 4.06 percent unemployment rate in February 2024.
Table 2 Unemployment Rate in Green Hills Region by County County Unemployment Rate Caldwell 3.6% Carroll 4.2% Chariton 3.5% Daviess 3.7% Grundy 4.5% Harrison 4.3% Linn 4.6% Livingston 3.4% Mercer 3.7% Putnam 4.6% Sullivan 4.6% Source: FRED Economic Data, February 2024
Median Household Incomes
Median Household incomes in the 11-county Green Hills region are shown in the following table. According to the US Census 2022 ACS, median annual household incomes ranged from a low of $50,950 in Putnam County to a high of $61,910 in Chariton County, Missouri. The state of Missouri median household income is $68,920, a significantly higher figure than any of the counties in the region. (See Table below)
Table 3 Median Household Income in Green Hills Region by County County Median Household Income Caldwell County $58,269 Carroll County $59,101 Chariton County $61,910 Daviess County $59,706 Grundy County $51,045 Harrison County $51,809 Linn County $58,435 Livingston County $58,772 Mercer County $55,592 Putnam $50,950 Sullivan County $53,438 State of Missouri $68,920 Source: 2022 American Community Survey; Census Bureau
Table 4 Regional Poverty Rates by County County Regional Poverty Rate Caldwell 16.1% Carroll 9.4% Chariton 13.3% Daviess 13.8% Grundy 16.5% Harrison 16.5% Linn 16.7% Livingston 10.4% Mercer 14.9% Putnam 12.3% Sullivan 15.1% Source: 2022 American Community Survey; Census Bureau
In 2020, Linn County had the highest poverty rate of 16.7%. Carroll County has the lowest poverty rate in the region at 9.4%.
Additional Groups There are several groups within the regional population that need to be identified separately. The unique needs and concerns of these groups may be addressed during the planning process. Two very important groups which have some overlaps are the elderly and the disabled. As of the 2020 census, the total population of the region was 91,644. Of that population, almost one fifth are over the age of 65, and more than half of those (50.9%) are disabled. In addition, more than one out of ten (12.3%) persons between the age of 16 and 64 are disabled.
Table 5 Disabled Population by County County Regional Poverty Rate Caldwell 15.1% Carroll 14.3% Chariton 17.6% Daviess 12.5% Grundy 15.7% Harrison 21.8% Linn 13.8% Livingston 15.5% Mercer 14.2% Putnam 10.4% Sullivan 16.7% Source: 2020 Decennial Census; Census Bureau
These are groups of substantial sizes with specific needs and concerns, which should be addressed first with an analysis of their geographic distribution throughout the region (see figure 2-3 & 2-4) and the transportation routes in their locations. Also, how transportation issues affect services and organizations like county health departments, EMS, hospitals, and the OATS system should be considered.
Table 6 Elderly Population by County (65+) County Regional Poverty Rate Caldwell 20% Carroll 21.9% Chariton 25% Daviess 20.9% Grundy 21.7% Harrison 22.1% Linn 21.4% Livingston 19.8% Mercer 21.9% Putnam 25.3% Sullivan 20.1% Source: US Census Bureau – 2022 American Community Survey 5-year estimate
Another group that warrants special consideration in the Green Hills Region is the Amish. The largest Amish settlement in Missouri is found near the City of Jamesport in Daviess County. As of 2020 Census, Daviess County (8.9%) is eleventh in the United States for in percent of Amish population. There are more than 150 large families residing in the area. Mercer, Harrison, Caldwell, Carroll, and Grundy Counties all have Amish communities. Horse-drawn buggies are the preferred mode of transportation for the Amish. The average buggy is 6 feet wide, built of light material, and travels at a speed from five to eight miles an hour. A four-thousand-pound car traveling 55 mph will close a 500-foot gap on a buggy traveling 5 mph in 6.5 seconds. When motorized vehicles collide with horse-drawn buggies, the result is often serious injury or death for the buggy passengers and horse. This danger is made more prevalent in the region due to poor quality or virtually non-existent shoulders common throughout the region. In addition to this, what shoulders there may be are composed predominantly of gravel, and do not hold up well under heavy buggy traffic. The narrow wheels cut furrows into the gravel, which become filled with water and erode with drainage, sapping the shoulders’ strength and shortening its functional lifespan. In many states there are stature laws that require any animal-drawn vehicle have a slow-moving vehicle (SMV) emblem and/or reflective material mounted on it so as to be visible from a distance of no less than five hundred feet to the rear when illuminated by standard low-beam headlamps. Historically, the Amish have been resistant to such regulation because they felt it infringed on the practice of their religious aesthetic, which demands simplicity and the avoidance of anything that attracts attention or could be construed as prideful. However, as time has gone by (and more people have been injured or killed in accidents) Amish communities have become more receptive to the safety practices and materials than they were in the past.
Sharing the road safely with the Amish Community
Chapter 4
Existing Transportation Facilities Roadways and Bridges The preliminary step of any transportation planning process must be to take an inventory of the existing roads and bridges: the number, classifications, use and condition. The Green Hills Region has many miles of state-maintained roadwaytwo interstate highways and about a dozen state highways, with a great number of lettered highways, in varying conditions. One American Legion Memorial Highway (65) and Highway 13 both run through the region and are the focus of a concerted effort along their length throughout the Missouri to upgrade both to four lane status. There is one VFW Memorial Highway (36) which bisects the region from east to west, a major traffic way that runs the width of the state from the Missouri River in the west to the Mississippi River on the east and is four lanes for most of its length. Part of the Lewis and Clark Trail also runs through the southern part of the region, along highways 10,24, and 5 in Carroll and Chariton Counties. Generally, the larger roads with heavy traffic loads receive more maintenance attention and are in better shape. Interstate Highways 35 and 36 are generally kept in good condition and most of the numbered routes, while lacking comfortably sized shoulders, are adequate. Of these major roads, 65 and 13 are the poorest conditions and the call for maintenance of both have evolved into a push to upgrade them into four lanes for their entirety throughout the state, spearheaded by a coalition of interested parties situated along both routes. Many of the lettered routes are in varying states of disrepair. Poor to nonexistent shoulders and large “chuck hole” are commonly reported problems. These rural routes are where many of the regions’ narrow and dilapidated bridges are found. There are just over 493 state-maintained bridges and 209 culverts in the Region. Of those, 51 are single lane bridges. Many have one of their three components. (Superstructure, substructure, or deck) rated as being in poor or serious condition, meaning that they are in desperate need of maintenance.
Existing Multi-Modal Assets
Railroads Railroads first made their way across the region in the late 1850’s with the construction of the Hannibal and St. Joseph railroad. After the end of the Civil War, the sale of surplus railroad land was intensely advertised and resulted in increased immigration of easterners to the region. In 1887 the Milwaukee railroad crossed the southern counties of the region. There were as many as seven different railroad companies traversing the region, but today there are only three left operating the remaining functional track, which all run southeast to northwest. Burlington Northern has two lines running through Carroll, Chariton, and Linn Counties. Norfolk and Western has a line running through Caldwell, Livingston, Sullivan, and Putnam, and Union Pacific runs through Caldwell, Grundy, and Mercer. Airports There are 18 airports, mostly of which are private and commercial use only. (There are no “major” airports in the region). Most of these are easily capable of receiving helicopter traffic as well. There are four dedicated heliports in the region, all private, at hospitals for medical transport.
Bike and Pedestrian Facilities Being mostly rural, bicycle and pedestrian paths are limited to the Green Hills Region. Most communities with a school have a football field and a track where people go to walk or run, but most of those discourage or outright disallow biking. Some communities, like Trenton and Chillicothe, have fair-sized park systems which allow them space for walking paths, but again most are not designed for bicycling. One location that is striving for the installation of a bike path is the City of Chillicothe, where local authorities feel that it would increase safety along Hwy 190 along the north edge of town, where the high school is located.
Ports and Waterways The two southernmost counties of the region have the Missouri River for their southern borders, and there are three barge ports (predominately associated with grain transport) in that area, as well as numerous boat ramps and river access points to all public use.
Chapter 5 National Traffic Control Standards National Traffic Control Standards are those standards specified by the US Department of Transportation in their Manual on Uniform Traffic Control Devices. These Standards specify which traffic signs, road markings, and signals are designed, installed, and used on the Federal Highway System, as well as on State and Local Public roads. All traffic control devices must generally conform to these standards. First released in 1935 eight subsequent editions of the manual have been published under the aegis of the National Committee on Uniform Traffic Control Devices, with numerous minor updates taking into consideration changes in usage and size of the nation’s system of roads as well as improvements in technology. Highway Standards Standards for Interstate Highways are defined by the American Association of State highway and Transportation Officials (AASHTO) in the publication A Policy on Design StandardsInterstate System. For a certain highway to be considered an interstate, it must meet these construction requirements of obtain a waiver from the Federal Highway Administration. These standards are: • Controlled accessAll access onto and off the roadway is to be controlled with interchanges and grade separations (including railroad crossings). Interchanges should provide full access; ramps are to be designed with the appropriate standards in mind. Minimum interchange spacing should be 1 mile in urban areas and 3 miles in rural areas; collector-distributor roads or other configurations that reduce weaving can be used in urban areas to shorten this distance. Access control (from adjacent properties) should extend at least 100 ft. in urban areas and 300 ft. in rural areas in each direction along the crossroad from the ramps. • Minimum speed of safe travelMinimum design speed of 70 mph in rural areas, with 60 mph acceptable in rolling terrain, and as low as 50 mph allowed in mountainous and urban areas. Sight distance, curvature, and super elevation according to the current edition of AASHTO’s A Policy on Geometric Design of Highways and Streets for the design speed. • Maximum gradeMaximum grade is determined by a table, with up to 6% allowed in mountainous areas and hilly urban areas. • Minimum number of lanes. -At least two lanes in each direction, and more if necessary for an acceptable level of service in the design year,
according to the current edition of AASHTO’s A Policy on Geometric Design of Highways and Streets. Climbing lanes and emergency escape ramps should be provided where appropriate. • Minimum lane widthMinimum Lane width of 12 feet. • Shoulder widthMinimum outside paved shoulder width of 10 foot and inside shoulder width of 4 foot. With three or more lanes in each direction, the inside paved shoulder should be at least 10 foot wide. If truck traffic is over 250 Directional Design Hour Volume, shoulders at least 12 foot wide should be considered. In mountainous terrain, 8 foot outside and 4 foot inside shoulders are acceptable, except when there are at least four lanes in each direction, in which case the inside shoulders should also be 8 foot wide. • Pavement slopingPavement cross slope of at least 1.5 % and preferably 2 % to ensure proper drainage on straight sections. This can be increased to 2.5 % in areas of heavy rainfall. Shoulder cross slope should be between 2% and 6% but not less than the main lanes. Land slopes within the clear zone should be at most 4:1 and preferably 6:1 or flatter. Roadside barriers should be used for slopes of 3:1 or steeper, in accordance with the current edition of AASHTO’s Roadside Design Guide. • Median widthMinimum median width of 36 foot in rural areas, and 10 foot in urban or mountainous areas. To prevent median-crossing accidents, guardrail should be installed in medians in accordance with the current edition of AASHTO’s Roadside Design Guide, based on traffic, median width and crash history. When possible, median openings between parallel bridges less than 30 foot in width should be decked over; otherwise, barriers or guardrails should be installed to exclude vehicles from the gap. • Recovery areasNo fixed objects should be in the clear recovery area, determined by the design speed in accordance with the current edition of AASHTO’s Roadside Design Guide. When this is not possible, breakaway supports or barriers guarding the objects shall be used. • Curb SlopeVertical curbs are prohibited. Sloping curbs are to be at the edge of the paved shoulder, with a maximum height of 4 inches. The combination of curbs and guardrail is discouraged, in the case the guardrail should be closer to the road than the curb. • Vertical clearanceMinimum vertical clearance under overhead structures (including over the paved shoulders) of 16 foot in rural areas and 14 foot in urban areas, with allowance for extra layers of pavement. Through urban areas at least one routing should be at least 17 foot above the road, except on urban routes with lesser clearance, where they should be at least 1 foot higher than other objects. Vertica clearance on through truss bridges is to be at least 17 feet. • Horizontal clearance under of along a bridge shall be the full paved width of the rest of the road. Bridges longer than 200 feet can be narrow, with a minimum of 4 feet on both sides of the travel lanes. • Bridge strengthNew bridges are to have at least MS 18 (HS-20) structural capacity. Weaker bridges that can continue to serve the route for 20 more years are allowed to remain. Additionally, existing bridges can remain if they have at least 12 foot lanes with 10 foot outside and 3.5 foot inside shoulders. Long bridges are to have at least 3.5 feet on each side of the travel lanes, bridge railing should be upgraded to current standards if necessary. • Tunnel clearanceTunnels should in theory be equivalent to long overcrossings, but because of the cost the standards can be reduced. Vertical Clearance is the same as under bridges, including the provision for alternate routing. Width should be at least 44 foot, which consists of two 12 foot lanes, 10 foot outside and 5 foot inside shoulders, and 2.5 foot safety walkways on each side. If necessary to meet the dimensions of the approach, this can be shifted left or right. A reduced width is acceptable due to the high cost. In this case, the minimum width is 30 feet with at least 2 feet more than the approach for the sum of the shoulder widths, but at least 24-foot total, and at least 1.5 foot on each side for a safety walkway. If there is no safety walkway, a 3-foot offset with a “safety shape” in the wall is acceptable. • The standards have changed over the years, resulting in many older interstates not being built to the current standards. Other roads were grandfathered in the system, and yet others are not built to standards because to do so would be too costly or environmentally unsound. Street Standards Street standards address the same issues as Highway Standards, but on the smaller scale of local roadwayscity streets and county or township roads whose construction and maintenance are not within the scope of MoDOT’s operations. These standards may vary greatly and are met with varying degrees of compliance. Signalized IntersectionsAmerican association of State Highway and Transportation Officials’ (AASHTO) Strategic Highway Safety Plan includes standards for nonsignalized and signalized intersections. The goal is to reduce the annual number of highway deaths. These standards may prompt actions ranging from low-cost measures such as modifying signal timing and signage, to high-cost measures such as
intersection reconstruction or grade separation, these standards are built on fundamental principles of user needs, geometric design, and traffic design and operation; safety and operational analysis techniques to address a range of concerns, from individual movements and approaches, pedestrian, and bicycle issues, to major corridors. The standards are designed with safety, operational performance, multimodal issues, and physical and economic factors in mind, and are based on the latest research on available methods and best practices in use by jurisdictions across the United States. Transportation System Management Transportation System Management is a discipline which seeks to identify improvements to enhance the capacity of existing transportation systems. Through better management and operation of existing transportation facilities, these techniques are designed to improve traffic flow, air quality, and movement of vehicles and goods, as well as enhance system accessibility and safety. Transportation systems management strategies are low-cost but effective in nature, which include, but are not limited to: • Intersection and signal improvements • Freeway bottleneck removal programs • Data collection to monitor system performance • Special events management strategies Traffic signal and intersection improvements include such elements as: • Signal timing optimization • Controller/cabinet and signal head upgrades • Vehicle detectors repair/replacement • Communication with a central system • Turning lanes • Grade separations • Pavement striping • Lane assignment changes • Signage and lighting Freeway and arterial bottleneck removal consist of identifying congested locations and improving such elements as: • Insufficient acceleration/deceleration lanes and ramps • Weaving sections • Sharp horizontal/vertical curves
• Narrow lanes and shoulders • Inadequate signage and pavement striping • Other geometric deficiencies The identification and elimination of traffic bottlenecks can greatly improve traveling conditions and enhance system capacity, reliability, and safety, especially during peak periods. TSM projects can complement the major capacity improvements and infrastructure by providing improved traffic flow on arterials and local streets. Transportation System Management can be broken down into several main elements, detailed below. Congestion Management A congestion management system is designed to avoid “capacity expansion”, literally the building of more roadways, if at all possible. Typically, analysis takes place first, viewing data (i.e. traffic volume) in relation to the geographic elements (“segments” or “corridors”) of a transportation system. Once a preliminary analysis of the entire system highlights the areas of highest congestion, a more detailed analysis of those specific areas can be conducted. Potential causes of congestion are reviewed, and a list of possible solutions is evaluated using a qualitative selection process, leaving only the most likely strategies to pass on to the pre-planning and modeling phase. The Congestion Mitigation and Air Quality Improvement Program (CMAQ) is federally mandated in SAFETEA-LU. The federal transportation bill reserves funding for projects that improve air quality in affected areas. Affected areas are defined as areas that are required by the Clean Air Act to address air quality issues. MoDOT distributes funding to eligible areas for project selection. The EPA determines the geographical boundaries for this program. The Federal Highway Administration and the EPA establish the Congestion Mitigation and Air Quality Improvement Program funding levels and eligible work types. The purpose of these funds is to reduce transportation-related emissions and improve air quality. Missouri receives approximately $24.3 million annually during SAFETEA-LU. The Missouri Highways and Transportation Commission approved a funding distribution during SAFETEA-LU of $2.7 million to Kansas City (MARC), and $21.6 million to St. Louis (EWGCG), provides funding for projects and programs in air quality non-attainment and maintenance areas for ozone, carbon monoxide, and particulate matter which reduce transportation related emissions. Priority in distributing funds is geared towards projects and programs involving diesel retrofits and other cost-effective emission reduction activities, and cost-effective congestion mitigation activities that provide air quality benefits including projects and programs that:
• Establish of operate advanced truck stop electrification systems. • Improve transportation systems management and operations that mitigate congestion and improve air quality. • Involve the purchase of diesel retrofits that are for motor vehicles or non-road vehicles and non-road engines used in construction projects located in ozone or particulate matter non-attainment or maintenance areas and funded under 23 USC. • Conduct outreach activities that provide assistance to diesel equipment and vehicle owners and operators regarding the purchase and installation of diesel retrofits. Additionally, Missouri, with a number of other midwestern states, is permitted to use program funding for the purchase of alternative fuels or biodiesel. Access Management Road systems serve two necessities, but often conflicting, functions: traffic movement and access to land. Access management is the regulation of interchanges, intersections, driveways and median opening to a roadway. Its objectives are to enable access to land uses while maintaining roadway safety and mobility through controlling access location, design, spacing and operation. It’s most evident on freeways where access is grade separated, and all movements are via dedicated ramps. It is very important on arterial roads where at-grade intersections and private driveways greatly increase the number of conflicts involving vehicles, cyclists, and pedestrians. It is also important on minor roadways for safety considerations such as driver sight distance. Planners, engineers, architects, developers, elected officials, citizens and attorneys all play a significant role in access management. Businesses frequently view any attempt to limit access to their land use as economically detrimental. This can make implementation controversial. However, there is growing body of evidence showing that access management can have the positive effect of increasing market area through reducing travel times on major roadways, and that minor increases in circuitry do not cause customers to stop patronizing businesses. Traditionally, the goal of access management has been to provide adequate access to land development while simultaneously preserving the flow of traffic on the surrounding road system in terms of safety, capacity and speed. However, it has become increasingly apparent that the planning and design of both roadways and neighboring land uses must be coordinated not only to simultaneously preserve that
functional integrity of the highway system while allowing efficient access to and from abutting properties, but also to serve the desired land use objectives of local communities. As cities expand, increased development along arterial highways generate more and more demand for driveways and intersecting local roads to serve abutting and nearby businesses, industries, and neighborhoods. Without access planning and management, arterials become increasingly congested, and safety is compromised. Planning the number of and controlling the location of access points helps to ensure both the safe and efficient flow of traffic and improved service to adjacent lands. The functional integrity of the arterial is maintained, and major capacity improvements are often not needed or can be delayed until a later date. At the same time, bicycle and pedestrian travel is made safer due to fewer sites for potential conflicts with vehicles turning into and out of intersecting driveways. In the older, developed portions of urban areas, access management was only possible on an ad hoc basis, with consolidation of removal of existing access being sought in conjunction with roadway reconstruction of urban redevelopment projects. It is primarily on the urban fringes that it is possible to coordinate transportation system improvements with land development to avoid creating situations where too much poorly spaced access renders a facility incapable of effectively serving its traffic-carrying function. When access management and land use planning are coordinated, it is possible to ensure that when properties are developed, site designs are compatible with efficient movement of traffic onto and off of public roadways and, at the same time, are conducive to pedestrian movements, bicycle traffic and transit usage. Proper access management, particularly with regard to spacing and type of access, can also be used as a tool, in conjunction with proper zoning, to help shape development patterns in a manner consistent with local community plans and desires. Right of Way and Corridor Preservation There is a growing awareness that land use decisions affect transportation needs and transportation improvements, in turn, affect land use decisions. Freeway interchanges and arterial road junctions have become focal points for new shipping centers, industrial parks and office complexes. Urban and suburban arterial roadways are lined with strips of roadside development. It has been argued that highway improvements have exacerbated problems of sprawling, uncontrolled development by providing easier access to urban fringe
areas and beyond. This development has, at the same time, affected the functional integrity of roadways by causing problems of congestion and capacity loss. Rapid, often unplanned, peripheral development has frequently been the source of major problems for both local and state transportation systems; buildings have often been constructed too close to the roadways, making future capacity expansion difficult and costly; and too many access points onto roadways have resulted in vehicle conflicts, reduced safety and a general deterioration in traffic flow. Once areas have been fully, or even partially, developed, there is often little that can be done to alleviate these problems. However, toward the peripheries of urban areas it will have existing and future facilities. Those who take part in the Transportation Planning process should always keep in mind the relationship between transportation and land use. This includes consideration of the likely effects of transportation decisions on land use and development and the consistency of plans and programs with the provisions of local land use and development plans. Corridor preservation is one means of coordination transportation planning with land use planning and development. Its goal is to prohibit, of at least minimize, development in areas which are likely to be required to meet transportation needs in the future. These areas include: lands adjacent to existing roadways which are projected to require capacity expansion, areas which might be needed to construct entirely new routes for urban bypasses or to serve new neighborhoods or commercial developments; and land needed for bicycle, transit and pedestrian facilities (e.g. bikeways, walkways, transit turnouts, bus ways and light rail corridors). When corridors are preserved in advance, negative land use and social impacts, as well as the costs of transportation improvements, are minimized. However, when land is not preserved for future needs, disruption of residences and businesses is a frequent result and the cost of obtaining the land accommodate improvements is likely to be considerably higher. At times the improvement needed cannot even be made because the disruption and cost would be too great. Transportation Demand Management Transportation demand management, succinctly is described as “the art of influencing traveler behavior for the purpose of reducing or redistributing travel demand.” The primary purpose of Transportation Demand Management is to reduce the number of vehicles using highway facilities while providing a wide variety of mobility options for those who wish to travel. A major emphasis of Transportation Demand Management strategies and actions exists to reduce single-occupantvehicle travel and the number of trips made by single-occupant vehicles. Reducing this type of travel limits congestion and enables the existing transportation
infrastructure to more traffic more efficiently. Commuters frequently are the focus of Transportation Demand Management actions because of their regular, predictable driving patterns, the possibilities of employer partnerships and the opportunities for ride-sharing programs. Transportation Demand Management has assumed a significant role in federal and local transportation policies through regional ridesharing agencies, transportation management associations, employers’ local ordinances and development agreements. Transportation Demand Management encompasses both alternatives to driving alone and the techniques or supporting strategies that encourage the use of these modes, tying closely to transportation energy conservation. Application of Transportation Demand Management alternatives and support strategies can occur at many different levels of government and the private sector. Common areas of Transportation Demand Management planning are those sites where there are many employers grouped together, such as a central business district, business park or shopping center, as well as large entertainment complexes or areas of highly concentrate housing. These areas highlight Transportation Demand Managements integral relationship with other elements of transportation planning, like access and congestion management. Transportation Demand Management is also applied on a regional basis (i.e. in a corridor, such as I-70) where government agencies often direct the initiative. For this type of application, the primary focus of the Transportation Demand Management program is to affect as many travelers as possible within the travel region. However, experience shows that the effectiveness of regional Transportation Demand Management programs depends greatly on the type and amount of participation by local entities in the region. Development of effective Transportation Demand Management programs therefore should be approached from the perspective of how community leaders, government, citizens, and private commercial and industrial interests can work together to meet the goals of providing greater mobility. Transportation Demand Management Strategies include: • Public mode supportPublicly provided alternatives to singleoccupantvehicle travel, including services and facilities that encourage and support other travel modes. • Employer-based supportPrivate-sector programs and services that encourage employees to change their commuting practices, typical TDM alternatives to single-occupant vehicles may include carpools and vanpools; public and private transit, including bus pools and shuttles; and non-motorized travel such as bicycling and walking.
• Telecommunications-Emerging demand-management solutions that are based on advanced telecommunications technologies. • Land-use policies, Planning and ZoningThe most effective long-term TDM strategies which have the abilities to shape population density, urban design, land-use mix, travel needs and travel patterns. • Public policy and regulationRestrictions and regulations that govern private vehicle use and provide political support and guidance to new institutional relationships. Energy Conservation In the United States, about half the air pollution comes from cars and trucks. Educating the public on ways to drive less and the use of smart driving practices reduces emissions. Some methods of “driving less” are • Carpool- (Missouri Rideshare and Carpool Programs) Rideshare is a free publicly funded commuter service designed to inform people about less expensive and environmentally friendly commuting alternatives. These include carpooling, vanpooling, transit programs, and employer services such as flextime and telecommuting. MARC Rideshare program serves Cass, Clay, Jackson, Platte, and Ray counties in Missouri and Johnson, Leavenworth and Wyandotte counties in Kansas. The MidMissouri Rideshare Program serves the counties of Audrain, Boone, Callaway, Camden, Cole, Cooper, Crawford, Gasconade, Howard, Maries, Miller, Moniteau, Morgan, Osage, Pettis, Phelps, Pulaski, and Randolph. • RideFinders is a free public service authorized and funded by the Federal Highway Administration for the purpose of lowering the amount of ozone pollution and traffic congestion in the St. Louis Metro area. RideFinders works in partnership with employers and commuters in the region to provide new transportation options that meet the above goals. Free services include carpool matching/vanpool formation and public transit information. RideFinders serves St. Louis City, St Louis County, Franklin, Jefferson and St. Charles Counties in Missouri and Madison, Monroe, and St. Clair counties in Illinois. • The City of Springfield offers a carpool matching service for the counties of Barry, Barton, Cedar, Christian, Dade, Dallas, Douglas, Greene, Jasper, Laclede, Lawrence, Ozark, Polk Stone, Taney, Webster, and Wright.
Some examples of “smart driving” practices are:
• Accelerate gradually • Use cruise control on the highway • Obey the speed limit • Combine errands into one trip • Keep vehicles tuned and support the smog check program • Don’t top off the fuel tank • Replace air filters regularly • Keep tires properly inflated Also, when purchasing a new vehicle, consumers should be encouraged to select the most efficient, lowest polluting model they can find, ideally either a non-polluting car or zero emission vehicle, which typically use “alternative” fuels. There are many fuels today being used as “alternatives” to gasoline. In most instances, alternative fuel is less polluting than gasoline, resulting in fewer harmful emissions into the air and a lower negative impact on human health. Many organizations in cities in the United States have voluntarily adopted programs to use alternative fuels in their fleets. These same cities are making efforts to provide the fueling infrastructure necessary to operate alternatively fueled vehicles, which are becoming more and more widely available. Biofuels are chemicals made from cellulosic biomass such as herbaceous and woody plants, agricultural and forestry residues, and a large portion of municipal solid and industrial waste. The two most common types of biofuels that are being developed and used in the United States. Corn ethanol and soy-based biodiesel burn more cleanly than gasoline and diesel. Their use strengthens rural economies, decreases America’s dependence on imported oil, reduces air and water pollution, and reduces greenhouse gas emissions. Biofuels are domestically grown renewable fuelsreducing our reliance on foreign oil. The Fuel Conservation for State Vehicles, Section 414.400-414.417 RSMo. And the Energy Policy Act establishes opportunities for Missouri state agencies such as MoDOT to better manage transportation fuel consumption, reduce waste, and promote the use of cleaner, domestic alternative fuels.
Chapter 6
Needs Assessment and Prioritization There are many varied transportation problems (needs) on the region’s transportation system. Identifying these needs is a continuous process and crucial for successful planning. Needs are identified from a variety of sources. Needs identification is not financially constrained. This is intended as a guideline and not an exact figure. The intent is to develop a list of all possible needs for evaluation. Although it is not feasible to address all needs. MoDOT has an obligation to consider them all. There are two types of needs: Physical and Functional Physical system needs related to the condition of the pavement and bridges, rough cracking pavement potholes, etc. Effective management of physical system needs includes preventative maintenance. Functional needs relate to operational aspects of the transportation system such as congestion, high accident locations, intersections that do not accommodate truck movement, or mobility needs connecting people to jobs and services. MoDOT uses a needs database to track the state’s transportation problems, and these needs are continuously updated at the district level. This needs identification is to be carried out by MoDOT’s district staff, area engineers, and project managers, in conjunction with the RPC’s Transportation Advisory Committee (TAC) and other sources of input from the public. Some aspects of the need’s prioritization are subjective in nature, and this cooperation will benefit the planning process immensely. For organizational purposes, as of 2012 needs will be classified as those that could potentially become STIP projects and those which fall under maintenance. This process will be carried out annually. Like needs identification, needs prioritization is not fiscally constrained, though it is limited to approximately 10 years of construction funds. This constraint is intended as a guideline. Needs selected for preliminary engineering studies will be taken from the high priority list. These needs will be fiscally constrained to approximately double the expected funding for a five-year period and will be eligible to move forward to MoDOT’s project scoping (development) process.
Appendix A contains the 2021 prioritized needs lists produced by the TAC. In addition, another transportation needs survey focusing on sidewalks has become part of the RTP process. This survey is designed to take inventory of the conditions of sidewalks in the region for transportation planning. This would benefit the jurisdictions applying for grant programs which can be used to fund sidewalk improvement projects. Maps depicting the results of these surveys are in Appendix B.
Chapter 7 This section contains a listing of projects in the Green Hills Region from the current Statewide Transportation Improvement Plan (STIP), effective 2024-2028.
Caldwell County US-36 • Pavement preservation treatment in Caldwell, Daviess, Grundy, and Linn Counties. Includes Rte. 36 in Linn County and Rte. 6 in Daviess and Grundy Counties.
RT A • Bridge rehabilitation on various bridges in Caldwell, Carroll, Chariton, Clinton, Daviess, and Livingston
RT D • Bridge replacement over Shoal Creek 3.5 miles north of Rte. HH and on Rte. E over Tom creek 1.0 mile east of Rte. 13. Project involves bridge p0428 and N0318.
Carroll County MO-10 • Pavement preservation treatment from Ray County line to Rte. 65 and on Rte. 136 (Nodaway County) from 0.8 miles east of Rte. 169 to West of Rte. C in Albany MO-139 • Upgrade pedestrian facilities to comply with the ADA Transition Plan in Carroll and Chariton Counties. Cities include Hale, Norborne, Bosworth, Keytesville, Sumner, Mendon and Rothville. $1,695,000 Statewide Transportation Alternatives funds. US-65 • Pavement resurfacing from Rte. 24 in Carrollton to the bridge over the Missouri River near Waverly. RT B • Bridge rehabilitation in Carroll, Chariton and Livingston Counties. Project involves bridges N0826, N0727, A1889 and L0548
Chariton County MO-5 • Pavement resurfacing from Rte. 24 to Saline County line and in Linn County from Rte. 36 to Bear Creek. Project also includes Rte. 41 in Carroll County from Rte. 24 to the Saline County Line.
Daviess County MO-13 • Pavement resurfacing from Rte. 6 in Gallatin to Hamilton south city limits
MO – 13 • Bridge Rehabilitation on various routes in Daviess, Grundy, Harrison, Linn, Mercer, Putnam, and Sullivan Counties. Project involves various bridges.
MO-190 • Bridge replacement over Clear Creek 0.3 miles from Rte. V near Lock Springs. Project involves bridge S0442. IS-35 • Pavement resurfacing from Rte. C near Pattonsburg to Rte. 69.
MO-6 • Pavement resurfacing west of Rte. V to the Grundy County line near Jamesport.
MO-6 • Bridge Rehabilitation in Daviess and Harrison Counties. Project involves bridges A1589 and A2291
Grundy MO-190 • Pavement resurfacing from Rte. 46 to Rte.6 near Jamesport. RT-E • Bridge rehabilitation in Grundy and Linn Counties. Project involves bridges X0153, P0891 and A1802.
Harrison IS-35 • Pavement resurfacing from Iowa State Line to Rte. N near Eagleville IS-35 • Pavement preservation treatment from Rte. N to Rte. 136 in Bethany IS-35 • Job Order Contracting for pavement repair from the Iowa State line to the Clay County line. US 69 • Bridge replacement over Zadie Branch 1.0 mile west of I-35. Project involves bridge L0267. RT N • Bridge rehabilitation over East Fork Big Creek 1.6 miles east of I-35. Project involves bridge A2402
Linn MO 11 • Payment to private entity to add turn lane at Park Circle Drive in Brookfield. $111,125 Cost Share Funds. MO 5 • Pavement resurfacing from Rte. 36 to Rte. 6 north near Milan. RT Y • Pavement resurfacing on Rte. Y, Rte. FF, Rte. DD, Rte. 130, and Rte. Y (Linn County), Rte YY, Rte. Y, Rte. FF and Rte. MM (Chariton County), Rte. V (Livingston County) and Rte. V (Grundy County).
Livingston US 36 • Pavement resurfacing on US 36 at Canadian Pacific Railroad and Rte 65 in Chillicothe and in the westbound lanes from Coon Creek to the Caldwell County line.
US 65 • Pavement resurfacing from Rte. 36 in Chillicothe to Rte. 24 in Carrollton. Impacts Canadian Pacific railroad at Rte. 65. RT B • Upgrade pedestrian facilities to comply with the ADA Transition Plan on Rte. B in Wheeling Rte K in Chula and Rtes. D and DD in Ludlow.
US 65 • Pavement resurfacing from 1.3 miles north of Rte. 190 to Rte. 36 in Chillicothe.
Mercer US 136 • Pavement resurfacing and add rumble strips from Rte. 65 in Princeton to Rte. C. $505,000 Open Container funds.
US 136 • Pavement resurfacing from Harrison County Line to Rte. 65 in Princeton.
US 136 • Section 14 streambank protection at bridge over Weldon Fork. Corps of Engineers to design and administer project. Cost shown represents MoDOT's share. Payment to Corps for design work. Project involves bridge A2634
US 136 • Pavement resurfacing from Rte. C to Rte. 5 west of Unionville.
US 65 • Upgrade pedestrian facilities to comply with ADA Transition Plan in Mercer and Putnam Counties. Towns involved are Mercer, Princeton and South Lineville.
Rt D • Bridge replacements in Carroll, Chariton, Grundy, Linn, Livingston, Mercer, Putnam, and Sullivan Counties. Design-Build Project
Rt E • Bridge rehabilitation in Mercer, Putnam, and Sullivan Counties. Project involves bridges A2636, N0254, P0833 and N0973.
Putnam US 136 • Pavement resurfacing from Rte. 5 west of Unionville to Rte. N at Livonia
MO 5 • Pavement resurfacing and widening from Iowa State line to Rte. 136 in Unionville
MO 5 • Pavement resurfacing and add rumble stripes from Rte. 136 east of Unionville to Rte. 6 north of Milan. $770,000 Open container funds
Sullivan MO 129 • Upgrade pedestrian facilities to comply with the ADA Transition Plan in Green City. $135,000 Statewide Transportation Alternatives funds.
MO 6 • Pavement resurfacing from Rte. 129 in Green City to west city limits of Green Castle
VARIOUS
• On-call work zone enforcement at various locations in the Northwest District. • Payback beginning in SFY 2008 for Safe and Sound bridges in the Northwest District. • On-call work zone enforcement at various locations in the Northwest District. • Job Order Contracting for guardrail and guard cable repair on various major routes in the Northwest District.
High Priority Unfunded Needs of the Green Hills Region
Tier I - None Tier II
Caldwell County
• Pavement Resurfacing from Nettleton to RTE. U
Carroll County
• Pavement Resurfacing from US 65 to RTE. F
Chariton County
• Bridge Improvements at Hickory Branch
Grundy County
• Bridge Improvements at Muddy Creek • Intersection Improvements at 20th Street South of Trenton
Harrison County
• Interstate Reconstruction
Linn County • Intersection Improvements at Locking Street • Interchange Improvements at RTE. 11
Tier III
Carroll County
• Raise 2-mile Section of Roadway to Mitigate Frequent Flooding • Bridge Improvement over Mound Creek
Chariton County
• Bridge Improvement over Cottonwood Creek
Daviess County
• Rehabilitate I-35 from RTE. C to RTE. 69
Multimodal Unfunded Needs
Linn
• City of Marceline – New Sidewalks on Rte. 5, North Kansas St., Ripley Park
Putnam
• AG Loading Pad/Fuel Systems Pad, Fueling and Jet Fueling Station, Lighting, Navaids, and Signage • Runway 17/35 Reconstruction • Apron Improvements • Runway Extension
Carroll
• New Amtrak Stop in Carrollton
Chapter 8
Transportation FundingAn Overview Great strides have been made in the past decade to improve the condition of Missouri’s roads and bridges while decreasing roadway fatalities to their lowest level since the 1940’s. However, those improvements were funded with temporary revenue sourcesa bonding program made possible by the passage of Amendment 3 in 2004 and the American Recovery and Reinvestment Act in 2009. While those funds supported a booming construction program between 2005 and 2010. MoDOT’s construction budget has been on a consistent decline since that time. Dwindling funds will continue to be a change during the 2016-2020 transportation planning cycle. About 63 percent of every dollar MoDOT receives comes from fuel taxes, but the fuel tax rate at the state level hasn’t changed since 1992 and the federal level hasn’t changed since 1993. In addition, cars are becoming more fuel efficient. With the cost of concrete tripled, steel prices doubled, and asphalt costing more than twice what it did 20 years ago, this means Missouri is trying to fund its current transportation needs with a budget that is almost two decades out of date. What was 17 cents of purchasing power in 1996 is now about 8 cents and decreasing each year. Other sources of state revenue for transportation include sales tax, vehicle, and driver licensing fees, interest earned on invested funds and other miscellaneous collections, and a small portion of general revenue funds. Revenue collected through these avenues has remained relatively flat in recent years, and the forecast for future revenue remains stagnant. Without any growth in state revenues, Missouri will not be able to match the federal funds by fiscal year 2023. With $1 of state funds, Missouri can use it to match $4 of federal funds. By 2024 there will be $400 million per year in potentially lost federal funds that Missouri will be unable to use. Those are transportation dollars Missourians paid through federal fuel taxes that could go to other states instead. Federal funding continues to be uncertain. On June 29, 2012, Congress passed “Moving Ahead for Progress in the 21st Century Act, MAP-21, aa two-year act set to expire September 30, 2014. After many months of discussion regarding the insolvency of the Highway Trust Fund, on July 31, 2014, Congress provided $10.8 billion from the General Fund and the Leaking Underground Storage Tank Trust Fund to the Highway Trust Fund and extended MAP-21 until May 31, 2015. Congress extended MAP-21 until July 31, 2015. Because of Missouri’s inability to match some of the current federal
funding, any increases would not be able to be matched as well. MAP-21 reduced the amount of funding for all state transportation departments, and Missouri received $71 million less per year for fiscal years 2012, 2013, and 2014 compared to fiscal year 2011. The federal assumptions for fiscal years 2016 and beyond are based on the reduced funding levels received during MAP-21. MoDOT continues to be one of the most efficient state agencies in difficult economic times. The department’s operating expenses remain flat, in addition to minimal increases related to healthcare and retirement costs. In the past ten years, MoDOT has completed 4606 projects worth $12.2 billion, 6 percent under budget. Since 2011, MoDOT has reduced its workforce by 20 percent, disposed of more than 750 pieces of equipment, and sold 124 facilities. Those efforts have saved more than $605 million and bolstered the construction program to enable critical roadway improvements. But the department cannot cut its way to an improved transportation system and a solution to its funding constraints. Even with these savings, Missouri has some rough roads ahead. Missouri’s 2016-2020 STIP was primarily maintenance-focused with little room for anything else. In previous years, the annual contractor awards in The STIP were as high as $1.2 billion, with about 50 percent used for taking care of the system. In this STIP, the contractor awards an average of $382 million, and nearly 85 percent is aimed at taking care of the existing system. To keep Missouri’s roads and bridges in the condition they are today requires $485 million per year. During this STIP cycle, Missouri’s construction awards are projected to fall far below that – to $325 million. The opportunities to expand the system: widening a busy two-lane road to four lanes to reduce congestion and improve safety, or building a new roadway or interchange to help promote business development and bring jobs to the state are disappearing. When the construction awards hit $325 million, MoDOT will have to adjust how it takes care of Missouri’s highway system. In February 2015, the commission approved “Missouri’s 325 System,” which will focus the limited resources in an effort equitable way. The state-maintained highway system will be divided into primary and supplementary routes. Primary routes include approximately 8,000 miles of the 34,000mile system and are the roads that connect cities across the state. Supplementary routes are the remaining miles used mostly for local travel. Nearly all of Missouri’s “major” roadways are part of the primary system. Only those major routes that function as business routes or loops or more like local roadways are excluded. MoDOT has decided to focus its limited resources on the primary system because it offers equity across the state between urban and rural areas. Every county in the state has at least one highway on the primary system.
The primary system differs from MoDOT’s current focus major and minor roads because the major roads, which make up 20 percent of the system and carry 80 percent of the traffic, are confined to limited areas of the state. It will take all $325 million to keep the primary routes in their current condition. MoDOT will only do limited routine maintenance on supplementary roads, which means their condition will deteriorate. These facts mean Missourians have some tough choices ahead of them. They rely on a modern and safe transportation system to get to work, school and everywhere in between. A healthy transportation infrastructure ensures businesses can operate and grow. It ensures the state can prosper and jobs can be created. Essentially, transportation is what keeps Missouri moving. Missourians must work together and recognize that investments in transportation are part of the solution for the state’s growth and prosperity. Federal Revenue The largest source of transportation revenue is from the federal government including the 18.4-cents per gallon tax on gasoline and 24.4-cents per gallon tax on diesel fuel. The last time either tax was increased was in 1993. Other sources include various taxes on tires, truck and trailer sales, and heavy vehicle use. These highway user fees are deposited in the Federal Highway Trust Fund and distributed to the states based on formulas prescribed by federal law through transportation funding acts. This revenue source also includes multimodal and highway safety grants (see Section 7 for a summary of all multimodal operations). Approximately 33 percent of Missouri’s transportation revenue comes from the federal government. State The next largest source of transportation revenue is from the state fuel tax. Fuel taxes represent the state share (approximately 27 percent is distributed to cities and counties) of revenue received from the state’s 17-cent per gallon tax on gasoline and diesel fuels which must be spent on highways and bridges. The last time the gasoline and diesel tax were changed was in 1992. This revenue source also includes a 9-cent per gallon tax on aviation fuel which must be spent on airport projects (see Section 7). These tax revenues provide approximately 30 percent of transportation revenues. The state motor fuel tax is not indexed to keep pace with inflation, and no rate increase has occurred since 1996. MoDOT receives a portion of the state sales tax paid upon the purchase of lease of motor vehicles. This revenue source also includes the sales tax paid on aviation fuel which is dedicated to airport projects. These tax revenues provide approximately 16 percent of transportation revenues.
In November 2004, voters passed constitutional Amendment 3, which set in motion a four-year phase in redirecting motor vehicle sales taxes previously deposited in the state’s general revenue fund to a newly created State Road Bond Fund. In state fiscal year 2009, the process of redirecting motor vehicle sales taxes to transportation was fully phased in, and the rate of growth in this revenue source slowed dramatically. Starting July 2013, state legislation eliminated the state motor vehicle use tax. The state motor vehicle use tax was replaced with the state motor vehicle sales tax which directs a greater portion of the tax to local government agencies. Future projected growth in this category is less than the rate of increase in construction and maintenance costs; therefore, not keeping pace with inflation. Vehicle and driver licensing fees include the state share of revenue received from licensing motor vehicles and drivers. This revenue source also includes fees for railroad regulation which are dedicated to multimodal programs. These fees provide approximately 15 percent of transportation revenues. Like motor fuel tax, the motor vehicle and driver licensing fees are not indexed to keep pace with inflation, and no registration fee increases have occurred since 1984. The interest earned on invested funds and other miscellaneous collections provides approximately 3 percent of transportation revenues. Cash balances in state transportation funds are declining. As referenced in Table 1 in Section 5-13, the cash balance of all state transportation funds is expected to decline from $853 million at the beginning of fiscal year 2016 to approximately $208 million by the end of fiscal year 2020. Other miscellaneous collections include construction cost reimbursements from local governments and other states, proceeds from the sale of surplus property and fees associated with the Missouri logo-signing program. The state General Revenue Fund provides approximately 1 percent of transportation revenue. The Missouri General Assembly appropriates it for multimodal programs. Other While not true revenue, bonding is a method of financing used by the Missouri Highways and Transportation Commission (MHTC) to receive the best value for every dollar spent. Statutory authority was established in May 2000 for MHTC to begin selling bonds, now called senior lien bonds. The senior lien bonds were limited to a total issuance of not more than $2.25 billion. The lien was closed after $907 million was issued from 2000 to 2003. The MHTC will issue no additional bonds under this lien. In November 2004, Constitutional Amendment 3 was approved by Missouri voters.
Amendment 3 redirects motor vehicle sales taxes to transportation. In accordance with this constitutional change, MoDOT began selling bonds and dedicated the funds to the Smoother, Safer, Sooner Program. Amendment 3 revenues are used for principal and interest payments on Amendment 3 debt. MoDOT sold $2 billion of Amendment 3 bonds and has completed all planned Amendment 3 bond sales. In fiscal year 2009, MoDOT sold $143 million of bonds for a portion of the new interstate 64, a design-build project in the St. Louis region. For the first time, MoDOT secured bonds primarily with federal funds, rather than state funds. These bonds are called Grant Anticipation Revenue Vehicle (GARVEE) bonds. In fiscal year 2010, MoDOT sold $100 million additional GARVEE bonds for the new Mississippi River Bridge project and $685 million for the Safe and Sound Bridge improvement Program. GARVEE principal and interest is scheduled to be repaid through the state fiscal year 2033. MoDOT sold $928 million of GARVEE bonds and has completed all planned GARVEE bond sales. Along with federal and state revenue, existing cash balances are used each year to remain fiscally constrained. The existing cash balances are made up of federal revenue and state revenue that have been deposited into MoDOT funds such as the State Road Fund, State Highways and Transportation Department Fund, and the State Road Bond FundThese funds are considered available for funding highway and bridge construction projects. Expenditures Other State Agencies Projections are based on fiscal year 2015 appropriation amounts; the personal service and fringe benefits growth rate assumption is 0 percent in fiscal years 2017, 2018, and 2020; 2 percent in fiscal years 2016 and 2019; and expense and equipment growth rates are 0 percent for fiscal years 2016-2016-2020. In fiscal year 2016, MoDOT estimates $259 million of other state agency expenditures grow to $263 million in fiscal year 2020. Debt Service Projections are based on the repayment of outstanding state road bonds. The amounts do not include capital or operating lease payments. In fiscal year 2016, MoDOT estimates $280 million of debt service expenditures grow to $295 million in fiscal year 2020. Operating Costs (includes Administration; System Management; Fleet, Facilities and information system; multimodal; and construction program operating costs) Projections are based on the fiscal year 2015 budget and fiscal year 2016 appropriations request; the personal service and fringe benefits growth rate assumption is 2 percent in fiscal
years 2016 and 2019, 0 percent in fiscal years 2017, 2018, and 2020; and expense and equipment growth rates average 0 percent for fiscal years 2019-2020. In fiscal year 2016, MoDOT estimates $721 million of operating expenditures grow to $741 million in fiscal year 2020, an average annual growth rate of 1 percent. Construction Program expenditures projections are based on a cash flow model that calculates payment schedules of MoDOT’s active and future construction projects. Contractor payments, right of way purchases, consultant engineering, accelerated program payments, sub-allocated federal funding for local governments and utility relocation costs are included. In fiscal year 2016, MoDOT estimates $949 million of construction program disbursements that falls to $507 million in fiscal year 2020. See Table 1, Section 5-13 for further details on the Construction program expenditures. Chart on expenditures
Total Expenditures Consistent with future transportation revenues, future transportation expenditures are also subject to many variables; however, using historical trends and various economic indicators, Figure 3, Section 5-12 provides an estimate of Missouri’s transportation expenditures for state fiscal years 2016 through 2020. As shown in Figure 3, estimated transportation expenditures (including costs associated with state advance construction projects) will decline from $2.2 billion in fiscal year 2016 to $1.8 billion in fiscal year 2020. From fiscal years 2016-2020, total expenditures exceed total revenue by $646 million, which is offset by projected cash balances totaling approximately $853 million available at the beginning of fiscal year 2016. The construction expenditures are derived from the cash flow analysis on the 2016-2020 Highway and Bridge Construction Schedule. These amounts decline primarily due to the end of many larger projects awarded in previous fiscal years. Assumptions for the construction program expenditures are in the next subsection. The remaining expenditures are expected to have inflationary growth as outlined above. See Table 1 in Section 5-13 below for a breakdown of expenditures by each budget category. Missouri’s Statewide Transportation Improvement Program (STIP) includes a five-year plan of highway and bridge construction projects, which is financially constrained for each fiscal year. Table 1 provides the cash flow analysis summary for the fiscal year 2016-2020 STIP. An adequate cash flow balance is
maintained as determined by projected monthly cash balances in any given year. MoDOT maintains at least a $100 million cash balance based on debt covenants and cash reserve to manage revenue and expenditure fluctuations. The amounts only include revenues and disbursements dedicated to highways and bridges since Multimodal and a portion of Highway Safely funding cannot be included in the minimum cash balance. Construction Program The actual dollar amounts for right of way and construction projects awarded in prior fiscal years, the estimated award amount for right of way and construction projects programmed in the STIP along with estimates for the construction budget based on the cash flow analysis of existing construction contracts and future construction contracts are summarized in the following discussion. For example, a construction contract awarded today can result in contractor payments over multiple years as the project is completed. The future award amount assumptions and the contractor payments assumptions resulting from the cash flow analysis are summarized in Table 2. Other expenditures are included in the Highway and Bridge Construction Program in addition to awards. These other expenditures include utility relocation payments, right of way payments, MoDOT and Consultant engineering, and accelerated program payments, as well as suballocated federal dollars that pass through MoDOT to local governments.
Missouri Transportation Funding
Source: MoDOT “Citizens Guide to Transportation Funding in Missouri” 2024 edition
Funding Distribution The Missouri Highways and Transportation Commission approved a funding distribution method in January of 2003 that was modified in June of 2004 and again in February of 2006. A modification in February of 2011 increased the annual amount set aside for the cost share and economic development program from $30 million to $35 million plus a variable amount based on debt refunding savings. A modification in March 2012 increased the annual amount set aside for the cost share and economic development program to $45 million. This funding distribution and its subsequent modifications were developed with extensive public involvement and are consistent with MoDOT’s mission. Values and tangible results. The following steps outline the distribution of funds for the Highway and Bridge Construction Program. Of the total funds available for awards, right of way, utilities, payments, and engineering include federally earmarked funds: Step 1: Deduct federally sub-allocated funds designated for specific purposes (varies) Step 2: Deduct funding for other transportation modes (aviation, railways, transit, and waterways) appropriated by the state legislature for the designated purposes (varies). This funding cannot be used for roads and bridges. Step 3: Deduct the financing cost for projects accelerated through bond financing. (varies) Step 4: Deduct funding for specific funding sources (varies). This includes categories such as Statewide Transportation Enhancement/Alternatives funds, special safety funds, Amendment 3 Funds for use on Element 3 of MoDOT’s Smoother, Safer, Sooner Program and federal discretionary (above-formula) earmarks for distribution to the related earmarked projects. Step 5: Deduct funding for the Economic Development and Cost Share Program (varies). The Economic Development and Cost Share Program has been suspended for SFY 2016. Step 6: Deduct funding contributed by partnering agencies (varies). These are funds dedicated to specific projects such as a city’s portion of a cost share project. Step 7: Deduct funding for project savings (varies). Savings or over-runs are credited or debited to specific districts or programs. Of the remaining funds available for road and bridge improvements:
Step 1: Allocate up to $460 million per year to taking care of the system. Allocate these funds as follows: $125 million for interstates/major bridges. $25 million for safety projects distribution based on a three-year average accident rate. $310 million for remaining taking care of system distribution based on a formula that averages: • Percent of total vehicle miles traveled (VMT) on the national highway system and remaining arterials. • Percent of square feet of state bridge deck on the total state system. • Percent of total lane miles of national highway system and remaining arterials. Step 2: Allocate up to $131 million per year to flexible funds that can be used for either taking care of the system or major projects and emerging needs. This amount may be reduced if funding is not available. This category is fully funded in 2016 and has some funding to allocate in 2017 through 2020. Distribution based on the average of: • Percent of total population • Percent of total employment • Percent of total VMT on the national highway system and remaining arterials Half of the rural area funding is distributed to the districts based on the above factors. The other half of the rural funding will be used for statewide rural projects. Federal Funding The current transportation bill, “Moving ahead for progress in the 21 Century” (MAP-21), was signed into law by President Obama on July 6, 2012. MAP-21 creates a streamlined performance-based, and multimodal program to address the many challenges facing the US transportation system. These challenges include improving safety, maintaining infrastructure conditions, reducing traffic congestion, improving efficiency of the system and freight movement, protecting the environment, and reducing delays in project delivery. MAP-21 funded surface transportation programs for fiscal years 2013 and 2014. The funding is slightly less than provided in the previous transportation bill, “safe, accountable, flexible, efficient transportation equity act: A Legacy for Users”
(SAFETEA_LU). The funding levels required transfers of $2.4 billion from the Leaking Underground Storage Tank Trust Fund and $18.8 billion from the general fund to the highway trust fund. MAP-21 restructures core highway formula programs. Activities carried out under some existing formula programsthe national highway system program, the interstate maintenance program, the highway bridge program, and the Appalachian development highway system program-are incorporated into the following new core formula program structure: • National Highway Performance Program (NHPP) • Surface Transportation Program (STP) • Congestion Mitigation and Air Quality Improvement Program (CMAQ) • Highway Safety Improvement Program (HSIP) • Railway-Highway Crossings (set-aside from HSIP) • Metropolitan Planning
It created two new formula programs: • Construction of Ferry Boats and Ferry Terminal Facilitiesreplaces a similarly purposed discretionary program. • Transportation alternatives (TA)- a new program, with funding derived from the NHPP, STP, HSIP, CMAQ and Metropolitan Planning programs, encompassing most activities funded under the Transportation Enhancements, recreational trails, and safe routes to school programs under SAFETEA-LU. MAP-21 was extended until July 31, 2015. Congressional action is required to continue federal funding beyond MAP-21. Our forecasted federal revenue is based on our anticipated annual obligation limitation, which is the amount authorized funding congress allows states to obligate in any given year federal funding for the 2016-2020 STIP will be obligated for the following (1) suballocated funding that flows through MoDOT to local governments, (2) converting advance construction projects and (3) current construction programs. First sub allocated federal funds will pass through MoDOT to local governments. Second, MoDOT will convert advance construction projects to regular federal funds (see Sections 5-20 through 5-21 for further information on advance construction). Lastly, any remaining federal funding will be available for the current construction program. See Figure 4, Section 5-19 for federal obligation authority assumptions used for the 2016-
2020 STIP. Starting in 2017. Missouri will not be able to match all available federal funds due to insufficient state revenue. Advance Construction (AC) MoDOT uses a federal funding tool called advance construction to maximize the receipt of federal funds and provide greater flexibility/efficiency in matching federal aid categories to individual projects. Advance Construction (AC) is an innovative finance funding technique, which allows states to initiate a project using non-federal funds, while preserving eligibility for future federal aid. Eligibility means the Federal Highway Administration (FHWA) has determined the project qualifies for federal aid; however, no present of future federal aid is committed to the project. States may convert the project to regular federal aid provided federal aid is available for the project. AC does not provide additional federal funding, but simply changes the timing of receipts by allowing states to construct projects with state of local money and seek federal aid reimbursement in that future. MoDOT began using AC in 1992 and will continue to use it in future years. MoDOT generally utilizes AC for national highway performance program (NHPP) and Surface Transportation System (STP) projects or when sufficient obligation limitation is not available. MoDOT anticipates sufficient revenue to cover new AC projects, as shown in Table 1, Section 5-13. Funding sources include existing cash balances, state motor fuel, motor vehicle sales tax and motor vehicle licensing and fees revenue, federal reimbursement (includes conversion of AC) interest and miscellaneous revenue. State funds pay for new AC project expenditures until federal aid is available. Once federal aid is available, the projects are converted to federal funds and previous state expenditures are reimbursed. The oldest projects are converted first, if possible, to maximize federal aid reimbursement. Which projects are converted also depends on what federal funds are made available. As displayed in Table 5, MoDOT anticipates the AC balance will be zero by state fiscal year 2017. The AC balance is driven by the relationship between available federal funds and the construction program. For example, if available federal funds are more than the size of the construction program, the AC balance will decrease. The amounts in Table 5 are based on MoDOT’s AC forecast. Also included in Table 5 are AC conversions of projects from prior STIP’s. The amounts are subject to change based on future federal apportionment amounts and categories.
Chapter 9
Plan Implementation The goal of the Green Hills Regional Transportation Plan is to provide guidelines for maintaining and growing an efficient and safe movement of goods, services, and people from one place to another. This plan is not meant to be a step-by-step manual for transportation planning, nor is it intended to dictate to the Missouri Department of Transportation which needs are to be addressed within the region. This plan contains the needs that have been compiled by the local public officials in the area, the Transportation Advisory Committee, and citizens within the counties of Caldwell, Carroll, Chariton, Daviess, Grundy, Harrison, Linn, Livingston, Mercer, Putnam, and Sullivan. The needs located within will only become recommendations to MoDOT for further research, study, and possible inclusion in the Statewide Transportation Improvement Program (STIP). As current needs are met or as changes occur within the region, it is anticipated that the plan will need updates and modifications. It is recommended that the plan be reviewed annually for any changes. Over the years, MoDOT in conjunction with its planning partners has been working to develop a transparent decision-making process which will assist in the selection of projects that feed into the STIP. Several funding streams are used by MoDOT when classifying projects, including safety, taking care of our system, major projects and emergency needs, and interstates and major bridges. Following is the list of needs generated in this plan, categorized by how they could fall into MoDOT’s funding streams. Safety The most important factor in any transportation system that carries people, services and goods is that it provides a safe environment and poses minimal risk to life and property. Intersection improvements and the redesigning of lanes and signal placement are examples of projects funded under this stream. Taking Care of Our System Most needs identified and prioritized by the Green Hills TAC will fall under the funding category of taking care of our system. This category includes possible needs that will
give motorists smoother roads and enhance or maintain the roadway. Examples of identified needs that fall under the category include road and bridge resurfacing, and widening of shoulders, which are common needs throughout the region. Major Projects and Emerging Needs Major projects and emerging needs include projects that are prioritized through the statewide planning framework process. These projects may include bridge replacements, economic development projects, or other projects that will allow for future development within an area. The greatest examples of needs identified by the Green Hills TAC that may fall under this funding category both involve highway corridors. The push for Highway 65 to be expanded to four lanes along its entire length has grown from what was originally a call for increased maintenance. If this project took place, it would have effects both on safety and economic issues vital to the region. Already a highly trafficked route, highway 65 corridor traverses’ areas containing some of Missouri’s best cropland and a number of bio-fuel operations are situated along it; biofuel operations that will generate thousands of jobs and lead to an increase in heavy truck traffic. There are many steep hills and sharp curves, the shoulders are narrow or even in some cases nonexistent and passing zones are few and far between. Another major project need involves the Missouri Highway 13 corridor, which like Highway 65 is seen as a north/south passage of state-wide importance. Despite the fact it’s deficient in safety standards, it presently carries a significant volume of traffic. Projects currently underway will resurface sections of the Highway and install rumble strips, and the roadway will be upgraded to four lanes between Richmond and Lexington Missouri. The Green Hills TAC has noted heavy local support for continuing these improvements on into the northern counties. Interstates and Major Bridges The Green Hills TAC has identified no needs that fall under the category of interstates and major bridges at the time. Local Transportation Management Tools Transportation management in the Green Hills Region is limited. The largest city in the region has a population of less than 11,000. As such, transportation management in the predominantly rural area is not a pertinent need. The cities of Chillicothe and Trenton do implement their own transportation management tools, as do a handful of smaller cities. The Green Hills Regional Planning Commission and the Green Hills TAC do not foresee recommending cities implement transportation management tools in the next five to ten years.
Adoption of the Green Hills Regional Transportation Plan The Green Hills Regional TAC is directly involved in all decision-making processes regarding the regional transportation plan. The group makes formal decisions based on the best interests of the entire region.