

The text of this document
Green Hills Region Missouri Public Transit Human Services Transportation Plan Prepared by: Amanda George Green Hills Regional Planning Commission 810 Washington Street Trenton, Missouri 64683 Approved and Adopted by GHRPC Board on (DATE)
Table of Contents Executive Summary ……………………………………………………………………3 Introduction ………………………………………………………………………….….3 Part I: Plan Development and Jurisdiction.……………………………………………4 Regional Demographics ……………………………………………………….6 Elderly..……………………………………………………………….….6 Disabled.…………………………………………………………………7 Low-Income.……………………………………………………………..8 Part II: Assessment of Available Services……………………………………………..11 Oats………………………………………………………………………………11 Medicaid Assistance…………………………………………………………….13 Northwest Missouri AAA………………………………………………………...13 Harrison County Courtesy Van………………………………………………….14 Private Transit Providers………………………………………………………….14 Part III: Assessment of Transportation Needs and Gaps………………….………..….15 Survey Results & Instruments……………………………………………………16 Part IV: Strategies for Improvement………………………………………….…………..16 Strategy 1……………………………………………………………………….…16 Strategy 2………………………………………………………………………….17 Strategy 3……………………………………………………………………….…17 Conclusion…………………………………………………………………………17 Appendix A: Maps ……………………………………………………………………..…18 Appendix B: Charts and Graphs…………………………………………………………24 Appendix C: Surveys: Paper & Online………………………………………………..….29 Appendix D: Raw Survey Results………………………………………………………...34 Appendix E: Contact Information/Outreach………………………….………………….39
Executive Summary Rural Transportation is very limited in the eleven-county region that makes up the Green Hills Region in Missouri. The region is underdeveloped due to several factors: lack of funding, lack of legislative support, and geography. The rural transit routes that are available in this region are not as accessible as would be desired. The development of a Coordinated Public Human Services Transportation (HST) Plan is a vital tool in community transportation planning. The entire purpose of this plan is to provide a tool to improve communication and collaboration across human service organizations and transportation providers. Ideally this plan would improve access, efficiency, and effectiveness of the transportation systems within our region. In 2007, the Safe Accountable, Flexible, Efficient Transportation Equity Act: A Legacy for Users (SAFETEA-LU) required that projects funded under Individuals with Disabilities, Job Access, and Reverse Commute Program (JARC), and New Freedom programs have a locally developed, coordinated public transit-human services transportation plan. In 2015, the Fixing America’s Surface Transportation Act (FAST Act) included the recommendation to increase participation by recipients of Federal grants in locally developed, coordinated planning processes. Today, the Federal Transit Administration requires that projects selected for funding under the Enhanced Mobility for Seniors and Individuals with Disabilities (Section 5310) Program be included in this Transportation Plan and requires that this plan be developed and approved through a process that included participation by seniors, individuals with disabilities, representatives of public, private, and nonprofit transportation and human services providers and other members of the public that utilize transportation services.
Introduction The Green Hills Regional Planning Commission is pleased to participate in the Coordinated Public Transit Human Services Transportation Plan. The purpose of this plan is to identify the transportation needs of individuals with disabilities, older adults, and people with low incomes. Once the needs have been identified the plan should provide strategies for meeting these needs and assign prioritization for the funding and implementation of these goals. Among the benefits of a Public Transit Human Services Transportation Plan are a better understanding of the resources and needs of the Green Hills Region; highlighting our priorities; and gathering regional data that could be used to improve, enhance, or modify the services available in this region.
Additionally, there are also considerations to providing adequate options for transportation to and from health care appointments, and a potential path forward in bridging the gaps that exist within our current available services.
Part I: Plan Development and Jurisdiction Federal legislation requires that the entire nation be covered by a locally developed plan. Each state has been given the responsibility of designating these regional boundaries. The Missouri Department of Transportation (MoDOT) made the determination that each Regional Planning Commission (RPC) or Council of Government (COG) would be responsible for creating the local plan in their region in 2008. Since each county in Missouri was covered by a local Regional Planning Commission the distribution of planning was targeted and based on a regional approach for the Public Transit Human Services Transportation Plan (PT-HST). The first plan update was developed in 2013, with an update required every 5 years. The eleven-county area making up the Green Hills Regional Planning Commission consists of the following counties: Caldwell, Carroll, Chariton, Daviess, Grundy, Harrison, Linn, Livingston, Mercer, Putnam, and Sullivan County. This region is in an area where public transit options are in short supply. In addition to relatively smaller populations there are large land areas with lengthy driving routes that make providing public transit a challenge. While public transit options are limited in this region, the demand for more services or expansion of existing services certainly exists. The Green Hills Regional Planning Commission (GHRPC) is pleased to lead the effort in this planning process. While the GHRPC is leading the process, per federal statute we will be including participation from community partners, senior citizens, individuals with disabilities, individuals with low income, as well as partner with public, private, and nonprofit transportation and human services providers. The Green Hills Region of North Missouri is largely agricultural and mostly rural. Most of the roads in the region are curvy, narrow, with little to no shoulders, which make them especially hazardous when there are weather events such as rain, sleet, snow, or ice. These farm-to-market roads comprise the bulk of the roads. There is one interstate in the region and there are a few major highways. Highway 36 provides an east-west link across the state. State Highways 5, 13, and 65 provide north-south corridors in the Green Hills Region and U.S. Highway 35 provides north-south interstate travel on the western side of the region. (See Map)
The planning process that GHRPC followed was done intentionally to include the individuals that would benefit the most from improvements to existing public transportation available in the region. There were surveys sent out to the city offices and an online survey was made available. Links to this survey were sent to the city offices, posted on GHRPC’s website and Facebook page. There was also a press release issued to the newspapers in the region that provided a link to the online survey and explained the purpose of the plan and its benefit to the region. Additionally, surveys and posters with a link to the online survey were sent to numerous human service organizations, food banks, and transportation providers throughout the Green Hills region. (A comprehensive list of those included in this outreach can be found in Appendix C and E).
Planning partners and members of the public were also given an opportunity to provide their own unique perspective in identifying services available, gaps in existing services that might be improved and were asked to provide strategies in bridging some of the gaps, and possible solutions to the transit needs of the eleven-county region. There were public meetings held in four of the counties. A press release was issued to all newspapers and radio stations in the region regarding the public meetings. GHRPC contact information was given for any interested individuals who were unable to attend. (For a summary of the locations of public meetings, posters, press release, and pamphlet see Appendix D).
Part II: Regional Demographics The PT-HST calls for a specific focus on the portions of the population that have the most need for reliable public transit. The three key areas that need to be looked at are as follows: the elderly population, the disabled population, and the portion of the population living in poverty. These three groups are the most likely to depend heavily on public transportation. In our region the population centers are in a largely agricultural community, therefore the distance to shopping, doctors, and other necessary errands can encompass many miles. Due to the lower populations in many of our counties, the available services can be very limited.
The Elderly As the population continues to age, north central Missouri, like the rest of the nation, faces challenges in meeting the transportation needs of its elderly residents. According to the 2020 Census the population of Missouri residents that are 65 and older is 17.6%. While the national average of persons over the age of 65 is 16.8%. As illustrated in Table 1, the population of elderly residents exceeds both the state and national average. This obviously needs to be taken into consideration when preparing the recommendations for our area. In fact, the average population that is over the age of 65 in our region is 21.02%.
Table 1Population Age 65+ Total Population Missouri Caldwell Carroll Chariton Daviess
6,154,913
% of Population Population 65+ 65+ 1033886 17.6% 19.76% 21.59% 18.78% 20.37%
Grundy Harrison Linn Livingston Mercer Putnam Sullivan
11874 14557
21.30% 22.08% 21.19% 19.82% 21.85% 24.72% 19.80%
Source: US Census Bureau 2020. uscensus.gov
Map 1Population Age 65+, Percent by Census Tract
Data Source: US Census Bureau, American Community Survey. 2020. Source geography: Tract
The Disabled Population According to the US Census Bureau in 2020 the national average of disabled persons is 13%. Missouri is higher than that with 14.8% of the overall population that is considered disabled. As you can see from Table 2, some of our counties have a significantly higher population that is disabled than the national average. Obviously, the more disabled persons in a region would indicate a higher need for public transportation. See Table 2 for a countyby-county breakdown of these figures. Once again, the limited funding and the rural nature of the area make it difficult for an organization to meet the demand of this targeted population.
Table 2Disabled Persons as % of Population Caldwell Carroll Chariton Daviess Grundy Harrison Linn Livingston Mercer Putnam Sullivan
Total Population 11874 14557
Disabled Persons
% of Population 14.78% 13.47% 16.82% 13.31% 15.00% 19.31% 13.47% 14.49% 15.43% 14.87% 11.32%
Data Source: US CENSUS Bureau 2020uscensus.gov
Map 2 - Disable Population, Percent by Census Tract
Data Source: US Census Bureau, American Community Survey. 2020. Source geography: Tract
Low Income The third factor that we must consider when we are examining our public transportation needs are the individuals that are living in poverty or are struggling to make ends meet. In
the north central Missouri region, many of the workforce commutes to another county to work. One must consider that the lack of available public transit, especially in the more remote areas, would be an obstacle to overcome if trying to rise above the poverty line. According to the 2020 Census Bureau the national average of individuals living in poverty is 12.8%. Missouri is slightly less than the national average at 12.7%. In addition, we must consider that the lack of available public transit would be a significant challenge if a person lacked a reliable source of transportation. In fact, while most residents of Missouri drive to work, carpool, or work from home; the data does suggest that there is a need for public transportation in the region that would accommodate individuals that were desirous of transportation to and from their place of employment. While the percentage of people that are currently employed that either walk, use other means of transportation, or use public transportation totals only 3.8% of the population it should be considered that people without a job currently that lack transportation might find the lack of public alternatives an obstacle to gaining employment. (See Chart 1) The national average of households without a vehicle is 8.45% and in Missouri this average is 8.3%. While most of our counties are well below both the state and national average, the number of households without a vehicle in this region is concerning. When you consider that most of our region is comprised of rural areas with long distances between cities, lacking access to a reliable vehicle is quite an obstacle. (See Chart 2)
Chart 1 – Means of Transportation to Work
Means of Transportation to Work (16 years and older) in Missouri
Drove Alone (73.9%) Carpool (7.6%) Worked From Home (14.7%) Walked (1.8%) Other Means (1.2%) Public Transportation (0.8%)
Data Source: US Census Bureau, DP03 ACS 1-year Estimates Data Profiles
Chart 2 – Percentage of Households Without a Vehicle
Percent of Households Without a Vehicle Percent of Households Without a Vehicle
9.57 8.55 7.48
Carroll
Chariton Daviess
5.84
4.9
4.41
Caldwell
7.1
6.41
6.2 3.55
Grundy Harrison
3.34
Linn
Livingston Mercer
Putnam Sullivan
Data Source: Resilience Analysis and Planning Tool (RAPT)
As you can see from Table 3, the population of the Green Hills region varies widely with some counties falling below the state average for percentage of the population living in poverty: Carrol, Daviess, Livingston, and Putnam. Unfortunately, the rest of the counties in this region are above the state and national average for the percentage of households that are living below the poverty line.
Table 3-Household Income & Poverty Median Household Income
% in Poverty
Caldwell
54,321.00
17.2%
Carroll
54,967.00
10.2%
Chariton
56,758.00
13.2%
Daviess
55,750.00
12.4%
Grundy
49,621.00
16.1%
Harrison
45,313.00
16.6%
Linn
54,245.00
15.5%
Livingston
54,309.00
11.1%
Mercer
52,105.00
13.5%
Putnam
46,161.00
12.1%
Sullivan
46,964.00
15.7%
Source: https://data.census.gov/vizwidget?g=040XX00US29&infoSection=Poverty
Map 3Population Below the Poverty Level
Source: htps://cares.page.link/hd1J
Now that we have examined the population in our region that falls within the specific areas that we were to consider when preparing the PT-HST, we can see that we have exceeded the national average in all three demographic groups in some areas. In fact, there are large parts of the region where we exceed the state and national averages in all three of the demographic areas. If we do not prioritize expanding our public transportation framework it is quite possible that we will continue falling further behind in this region. The update to this PT-HST plan will ensure that we remain eligible for funding of public transit services.
Part III: Assessment of Available Services Public transit services available to individuals are very sparse throughout the Green Hills region. Out of the eleven-county region there are some more options available in the more populous areas on a daily basis, however the majority of the region has weekly services at best. There in only one public transit service available throughout the entire region: OATS Transit.
OATS Transit OATS Transportation is the only public transit available in the Green Hills Region in every county. As you can see, the availability of public transportation in some of our most elderly counties is extremely limited.
OATS is a public service and will provide transportation to anyone regardless of age, income, or disability and is the only provider that is accessible in all eleven counties in the Green Hills Region. According to the OATS website they provided 956,492 rides in the 2022 fiscal year. They currently have 752 vehicles and travelled over 11 million miles delivering people to their destinations. However, while the service that OATS Transit provides to this region is invaluable, there are some very serious limitations to where they will be able to take a rider. For example, in some of the smaller more remote counties, there is a twice monthly trip to a neighboring town. The more populous counties have more destinations, but if a person wanted to travel outside of their area for work OATS would not be a viable solution. The benefit to this service is that people without transportation can travel to neighboring areas but there is not a guaranteed on-demand service. Table 4 breaks down the OATS Transportation in the Green Hills Region. The only two counties that have riders travelling to work are Livingston and Grundy. This is most likely due to the fact that Trenton and Chillicothe are two of the only cities in the region that offer OATS Transportation services every day. It is also worth mentioning that all payment must be received prior to the trip and can only be done online. The drivers cannot accept payment when you get on the bus, which had been an option in the past. Currently a rider must have arranged this in advance of their trip by paying online. This may be an obstacle for some of the riders that are most in need of the transportation services.
Table 4: Rides Taken in Fiscal Year 2023 County Caldwell County
Number of Trips
Carroll County
8,783
Chariton County Daviess County
5,883 3,184
Grundy County
5,648
Harrison County
4,667
Number of Unduplicated Top Trip Purposes in Order of Most Riders Trips Medical, Shopping, Food Pantry, Recreation Business, HeadStart, Medical Shopping HeadStart, Medical, Shopping Sheltered Workshop, Shopping, Medical, Recreation Business, Education, Employment, Food Pantry, Medical, Nutrition, Recreation, Shopping, Sheltered Workshop Business, Dialysis, Food Pantry, Medical, Recreation, Shopping, Sheltered Workshop
Linn County
1,413
Livingston County
23,245
Mercer County
1,590
Putnam County Sullivan County
Dialysis, Food Pantry, Medical, Shopping Business, Employment, Medical, Senior Center, Recreation, Shopping, Sheltered Workshop Medical, Shopping, Sheltered Workshop Medical Medical
Source: Table was generated at OATS home office. Provided via e-mail.
Chart 4 - Percent of Population Using OATS & Number of OATS Buses Per County
2.8
1.9 0.5
1.6 0.5
0.6
Number of Buses
0.5
0.3
0.8
% of Population
Medicaid Assistance There is a limited option for persons with Medicaid. If they need a trip to a medical appointment they may arrange this at minimum 2-3 days in advance. This is a free service but there is no guarantee of availability. Medicaid contracts this work out with several providers throughout the state.
Northwest Missouri Area Agency on Aging The Northwest Missouri AAA assists its clients in 18 counties in Northwest Missouri. The counties in the Green Hills region that receive assistance are: Caldwell, Daviess, Grundy, Harrison, Linn, Livingston, Mercer, Putnam, and Sullivan. The residents of Carroll and Chariton counties are not eligible for this service. Some of the services that are provided by
NMAAA are group transportation, client reimbursement transportation, and provide-a-ride (PAR). PAR is not available in all of their counties, but this service provides a trained volunteer driver to take the person utilizing the service to their destination. This type of service would be to provide a client with a trip for a non-emergency medical appointment, essential shopping trips, and to senior centers for meals. The NMAAA will reimburse the volunteer on a per-mile basis. This is specifically designed to reimburse the driver when the person in need of the ride does not have the means to do so. The purpose of the NMAAA is to help senior citizens retain their independence by transporting them where they need to go. If there is not a volunteer driver available, the client is offered reimbursement. While this service provides a valuable service because it addresses the transportation needs of the elderly it does not provide services for the other demographic groups that this study is trying to address. A person that was disabled or was simply to poor to have access to reliable transportation would not be able to use this service.
Harrison County Courtesy Van The Harrison County Hospital currently has a courtesy van that is wheelchair accessible and available to residents of Harrison County. This service is funded through the Harrison County Community Hospital District’s foundation and a grant from the Missouri Elderly and Handicapped Transportation Assistance Program. There is a full-time driver that does most of the driving and scheduling of the appointments. There is a part-time driver that will fill in as needed. Transportation is available by scheduling throughout the entire 726 square miles of Harrison County. Currently the van provides rides to an average of eight patients per day. Last year the van made nearly 7,000 round trips. The van can deliver patients to the main campus of HCCH as well as two other clinical sites. In addition to providing transportation the van can also make a stop by a pharmacy to fill a prescription before returning the rider to their home. Currently, this service is only provided in one of our eleven counties, but it certainly should be taken into consideration when looking toward the future. As our population continues to age, this service if provided in multiple counties, would be a major improvement in transportation to and from health care appointments.
Private Transit Providers The other providers of public transit in this area are very limited. There are a very small number of taxi services in very limited areas. A number of churches provide transportation to and from their worship services.
Part III: Assessment of Transportation Needs and Gaps Public transit needs are abundant in the Green Hills region. A large majority of the population that cannot drive would not be able to reach a desired destination without walking or utilizing the existing services in the region. The unavoidable conclusion regarding public transit in the Green Hills Region is that the supply is not currently able to meet the demand. Individuals in Bethany, Trenton and Chillicothe have access to in-town service Monday through Friday. Milan has 2 days each month where in-town services are offered and Brookfield has one day each month where in-town services are offered. The rest of the region must rely on the set schedule to travel out of town, many limited to just a couple of days per month. This lack of availability would prevent individuals from going to the doctor, bank, church, shopping, and social activities. In fact, this lack of availability would be a hindrance to individuals that lack transportation being able to live independently. Additionally, the survey respondents expressed that they would utilize public transportation more if it were available. There was an indication that people are unaware of the options that are available. There were also several people, both individuals and human service organizations that expressed a difficulty in getting people from this region transportation to Kansas City and St. Joseph for specialist appointments and procedures not performed at our area hospitals. In fact, this was the source of most comment. Several respondents indicated that even if they had arranged a ride prior to the day of the appointment, there was no guarantee that they would in fact have a ride. As our regions’ population continues to age, this gap in service will only become worse. Low-income persons are not served with the current availability of public transportation. This population would most likely benefit from better access to transportation in order to provide access to employment. However, without reliable methods of transportation to and from work these individuals will be unable to secure better jobs and will continue to struggle to improve their financial situation. There is evidence to support the conclusion that the needs of the disabled population would benefit greatly from improved access to public transportation and increased availability. An obstacle for the disabled population is the lack of specialized vans. More than one respondant indicated that even if transportation had been arranged in advance, there were times that the ride was cancelled. These cancellations were attributed to lack of personnel or accesssible vans being utilized elsewhere. In order to reach the individuals that utilize public transportation the most the Green Hills Planning Commission held four public meetings. These meetings were advertised in local newspapers, local radio stations, and on the GHRPC Facebook page.
Green Hills Regional Planning Commission also prepared surveys. These were done both in paper and online. The paper surveys were sent to each city hall in the eleven-county region and the online survey was advertised in the local newspapers in the region, on the GHRPC website, the GHRPC Facebook page, and flyers were sent out to numerous human service organizations and transportation providers in an attempt to gain more information. (See Appendix C for the survey instruments, list of organizations that were contacted, and flyers used.)
Survey Results & Instruments While the data presented would suggest that a significant number of the population in this region have barriers to transportation, the analysis must also take into account the opinions of the respondents of the survey. There is data that suggests that there is a large portion of the eleven-county region that would benefit from public transportation. However, due to a lackluster response from the public at the public meetings, it is hard to determine the extent of the need. Despite the numerous attempts to get responses to the survey, there were only 37 returned when combining the online survey and the paper surveys. The online survey consisted of nine questions, and the paper survey contained 16 questions. However, the answers received did reinforce the conclusions drawn from this regions’ data. (The survey instruments and responses can be found in Appendix D.)
Part IV: Strategies for Improvement The OATS transportation system is incredibly valuable to the Green Hills Region. Without this organization many individuals throughout the region would not have adequate access to goods and services necessary for independent living. The Public Transit planning group discussed many options for public transit improvements, efficiency upgrades, and expansion. The following strategies were adopted in the previous plan and the committee determined that the priority was to maintain these goals. At this time, little has changed in the region from the previous plan, and maintaining the goals was determined to be the best course of action. The Public Transit planning committee decided to maintain the following three goals for the next five years. Strategy I: Maintain the Current System Priority: High Example Action Items: Challenges: Equipment replacement or upgrades Lack of staff available Additional Staffing Limited funding Replacing vehicles at end of useful life Maintaining the current system is the most important goal for the Green Hills Region’s Missouri public transit system. There are obstacles to maintaining the current level of
services provided by OATS, these obstacles would be maintaining staff, and vehicle maintenance and replacement when necessary. Currently, most of the vehicles servicing the Green Hills Region are due for replacement, that is why this is a high priority. Strategy II: Expand the Current System Priority: High Example Action Items: Challenges: Equipment replacement or upgrades Lack of staff available Additional Staffing Limited funding New equipment necessary Lack of local match to expand services Expansion of the current system is also a high priority for a successful public transit system in the Green Hills Region. It was the recommendation of the transit planning commission that this be the second goal of the transit study. Our current system does not meet all of the needs of the region, and ideally there could be a new source of revenue found to expand the current public transit system as it currently exists. There are several different ways that the current system could be expanded, and any funding from a local source could provide new options for the current transit system. Strategy III: Outreach & Education Example Action Items: Provide more information to the public regarding public transit and current services available.
Priority: Medium Challenges: Lack of staff available Limited funding
The current public transit available in the area could be better understood by the public. During the outreach phase of the plan it was discovered that there was a general lack of understanding about what services were actually provided by OATS Transportation and who was eligible to receive the services. Prioritizing informing the public of their options, and availability might make it more accessible to vulnerable populations.
Part II: Conclusion The availability of public transportation for people in the Green Hills region is not sufficient to meet the needs of all the people in need of services. The lack of available public transportation leaves many people in this region without a convenient or readily available option. Unemployed people without transportation are very likely unable to arrange transportation to a job unless they are able to find work within biking or walking distance to where they live. Their options are very limited and the prospect of bettering their lives look bleak. The public transportation system that we currently have in this eleven-county region is insufficient to meet the transportation needs of the low-income population.
An inescapable conclusion is the availability of public transportation is inadequate for many of the citizens of this region. While the region does have some public transportation available, it would benefit greatly from more options and availability, especially for ondemand services. Therefore, it was the conclusion of the transit planning committee that the previous goals should be the priorities for the next five years. The current system, while not ideal, should at the very least be maintained at the current leve. If possible funding could be obtained, the current system should be expanded. Finally, the public could be better informed about what the current services are, and how to obtain transportation.
Appendix A: Maps
Map 1Population Age 65+
Data Source: US Census Bureau, American Community Survey. 2020. Source geography: Tract
Map 2Disable Population, Percent by Tract
Data Source: US Census Bureau, American Community Survey. 2020. Source geography: Tract
Appendix B: Graphs & Charts
Table 1Population Age 65+ Total Population
Population 65+
% of Population 65+
Missouri
6,154,913
1033886
17.6%
Caldwell
19.76%
Carroll
21.59%
Chariton
18.78%
Daviess
20.37%
Grundy
21.30%
Harrison
22.08%
Linn
11874
21.19%
Livingston
14557
19.82%
Mercer
21.85%
Putnam
24.72%
Sullivan
19.80%
Source: US Census Bureau 2020. uscensus.gov
Table 2Disabled Persons as % of Population Total Population Caldwell Carroll Chariton Daviess Grundy Harrison Linn Livingston Mercer Putnam Sullivan
11874 14557
Data Source: US CENSUS Bureau 2020uscensus.gov
Disabled Persons
% of Population 14.78% 13.47% 16.82% 13.31% 15.00% 19.31% 13.47% 14.49% 15.43% 14.87% 11.32%
Table 3-Household Income & Poverty Median Household Income
% in Poverty
Caldwell
54,321.00
17.2%
Carroll
54,967.00
10.2%
Chariton
56,758.00
13.2%
Daviess
55,750.00
12.4%
Grundy
49,621.00
16.1%
Harrison
45,313.00
16.6%
Linn
54,245.00
15.5%
Livingston
54,309.00
11.1%
Mercer
52,105.00
13.5%
Putnam
46,161.00
12.1%
Sullivan
46,964.00
15.7%
Source: https://data.census.gov/vizwidget?g=040XX00US29&infoSection=Poverty
Table 4: Rides Taken in Fiscal Year 2023 County Caldwell County
Number of Trips
Carroll County
8,783
Chariton County Daviess County
5,883 3,184
Grundy County
5,648
Harrison County
4,667
Linn County
1,413
Livingston County
23,245
Mercer County
1,590
Putnam County Sullivan County
Number of Unduplicated Top Trip Purposes in Order of Most Riders Trips Medical, Shopping, Food Pantry, Recreation Business, HeadStart, Medical Shopping HeadStart, Medical, Shopping Sheltered Workshop, Shopping, Medical, Recreation Business, Education, Employment, Food Pantry, Medical, Nutrition, Recreation, Shopping, Sheltered Workshop Business, Dialysis, Food Pantry, Medical, Recreation, Shopping, Sheltered Workshop Dialysis, Food Pantry, Medical, Shopping Business, Employment, Medical, Senior Center, Recreation, Shopping, Sheltered Workshop Medical, Shopping, Sheltered Workshop Medical Medical
Source: Table was generated at OATS home office. Provided via e-mail.
Chart 1 – Means of Transportation to Work
Means of Transportation to Work (16 years and older) in Missouri
Drove Alone (73.9%) Carpool (7.6%) Worked From Home (14.7%) Walked (1.8%) Other Means (1.2%) Public Transportation (0.8%)
Data Source: US Census Bureau, DP03 ACS 1-year Estimates Data Profiles
Chart 2 – Percentage of Households Without a Vehicle
Percent of Households Without a Vehicle Percent of Households Without a Vehicle
9.57 8.55 7.48
Carroll
Chariton Daviess
3.55
Grundy Harrison
Data Source: Resilience Analysis and Planning Tool (RAPT)
5.84
4.9
4.41
Caldwell
7.1
6.41
6.2
3.34
Linn
Livingston Mercer
Putnam Sullivan
Chart 4 - Percent of Population Using OATS & Number of OATS Buses Per County
2.8
1.9 0.5
1.6 0.5
0.6
Number of Buses Data Source: Email provided by OATS Transportation
0.5
% of Population
0.3
0.8
Appendix C: Survey Instruments
Green Hills Regional Planning Commission Transit Study (Online Survey) Question Title
1. Are you currently employed?
Walk
YesFull-time Bicycle YesPart-time Van (provided by my service agency) No Question Title
Other (please specify)
2. If you are employed, in which city do you work?
Question Title
3. What is your age? Under 18 18-24
Question Title
6. Do you currently use public transit services? Yes No Question Title
25-34
7. What destinations do you use public transportation for? Bank
35-44 Cemetery 45-54 Church 55-64 Community Center 65+ Question Title
Daycare
4. Are you able to drive? Yes No Question Title
5. What modes of transportation do you use at this time? (Check all that apply)
Employment Grocery Store Hairdresser Library
Personal vehicle Local hospital or clinic Taxi Long distance medical Public transportation Nursing homes Friend/Family vehicle
Pharmacy
Increased service from a park-and-ride lot to work
Post Office
Expanded service hours per day
School/University
Expanded days of service between counties
Senior Center
Expanded weekend service
Shopping Center
More express service (fewer stops)
Social Security Office
Cost-share program with employer
Social Services
Guaranteed ride home
Social/Recreational facilities
Service close to my home
Department of Veteran's Affairs
Expanded forms of payment excepted
Veterinarian
Cleaner buses
Volunteer organizations
Newer buses
WIC Office
Other (please specify)
I do NOT use public transportation Question Title Other (please specify)
9. Would you be willing to pay for public transit services? Yes
Question Title
8. What changes could be made to public transit services that would allow you to use the service for the first time or to use the service more often? More flexibility in scheduling rides
No
Survey for Transit Study (The Paper Survey) 1.
In what city & county do you live? ______________________________________________
2.
Are you currently employed? Yes, full-time. Yes, part-time. No. If employed, in which city do you work? _________________________________________
3. 4. 5.
6.
What is your age? __________________________ What is your gender? Male Female If employed, what is your occupation? ________________________________
7.
Do you have a valid driver’s license? Yes No 8. Are you able to drive? Yes No 9. Which of the following modes of transportation do you use? (Check all that apply) Personal vehicle. Taxi. Public transit vans. Friend/family vehicle. Walk. Bicycle. Other, (please specify). 10. Do you currently use public transit services? Yes No 11. If you answered yes to Question 10, what destinations do you use public transit services for? (Check all that apply) Bank Church Community center Daycare Employment Grocery store Hairdresser Library Local hospital or clinic Long distance medical Nursing homes
Pharmacy Post office School/University Senior center Shopping Centers Social Security Office Social Services Social/Recreational facilities Department of Veterans Affairs Veterinarian Volunteer organizations WIC office Other (Please specify) 12. If you answered no to Question 10, why do you not use public transportation? 13. What changes could be made to public transit services that would allow you to use the service for the first time or to use the service more often? Check all that apply. More flexibility Increased service hours Increased service area Expanded days of service More express service Cost-share program Guaranteed ride home Service close to my home Expanded forms of payment Cleaner buses Other: 14. Of your choices in Question 13, which ONE answer would improve public transit services the most and increase your personal usage? ___________________________________________ 15. Would you be willing to pay for public transit services? Yes No 16. Please add any additional thoughts that you have on the state of public transit services in your area.
Appendix D: Raw Survey Results
Results from Survey Are you employed?
Are you employed?
yes
yes-part time
unemployed
2. If yes, in which city do you work?
Chillicothe
Princeton
Trenton
Carrollton
City
3. What is your age?
What is your age?
Under 18
18-24
25-34
35-44 What is your age?
45-54
55-64
65+
4. Are you able to drive?
Are you able to drive?
yes
no Are you able to drive?
5. What modes of transportation do you use at this time? (Check all that apply.)
Modes of Transportation walk van bicycle friend/family vehicle public transportation taxi personal vehicle
Modes of Transportation
6. Do you currently use public transit services?
Do you use public transit services?
yes
no
7. What destinations do you use public transportation for?
Destinations 4.5 3.5 2.5 1.5 0.5
Destinations
8. What changes could be made that would make you more likely to use public transportation?
What would make you more likely to use public transit?
What would make you more likely to use public transit?
9. Would you be willing to pay for public transit services?
Would you pay for public transit services/
Yes
No
Appendix E: Contact Information/Outreach
Organizations That Received Flyers & Questionnaires Human Services Organizations Carrollton Housing Authority 107 N Monroe St. Carrollton, MO 64633 Caldwell Victims Advocate 49 E Main St Kingston, MO 64650 Carroll County Family Support Division 1303 North 65 HWY Carrollton, MO 64633 Caldwell County Foundation Inc. 275 N Washington St. Kingston, MO 64650 Caldwell County Family Support Division 400 W Berry St. Hamilton, MO 64644 Missouri Valley Human Resource 16 S Folger St. Carrollton, MO 64633 Family Service Division 309 E 3rd St. Milan, MO 63556 Grundy County Services Center 1506 Oklahoma Ave. Trenton, MO 64683 Grundy County Family Services 2926 Oklahoma Ave. Trenton, MO 64683 Family Service Division 121 E Jackson St. Keytesville, MO 65261 Missouri Valley Human Resource
601 E Broadway St. Brunswick, MO 65236 Health & Senior Services 2403 Vandivert St. Bethany, MO 64424 Jamesport Outreach Clinic 409 W Auberry Grove Jamesport, MO 64648 Grundy County Services Center 1506 Oklahoma Ave. Trenton, MO 64683 Daviess County Nursing & Rehab 1337 W Grand St. Gallatin, MO 64640 Missouri Valley Comm Action Ag 314 E 6th St Salisbury, MO 65281 Livingston County New Horizons 400 Youssef Dr Chillicothe, MO 64601 Community Resource Center 913 Webster St. Chillicothe, MO 64601 ResCare Workforce Services 1301 Washington St Chillicothe, MO 64601 Community Options 801B Washington St. B Chillicothe, MO 64601
Department of Social Services 501 W Main St.
Princeton, MO 64673
Brookfield, MO 64629
Mercer County Senior Center 110 N Broadway St. Princeton, MO 64673
Hedrick Medical Center 2799 Washington St. Chillicothe, MO 64601
Family Support Division 702 S. 27th St. Unionville, MO 63565
Sullivan County Memorial Hospital 630 W. 3rd St. Milan, MO 63556
Putnam County WIC 1613 Grant St. Unionville, MO 63565
Mosaic Life Care 1707 E 9th St. Trenton, MO 64673
Preferred Family Healthcare 1628 Oklahoma Ave. Trenton, MO 64683
Crestview Home 1313 S 25th St Bethany, MO 64424
Sullivan County WIC 1 Hawthorne Dr. Milan, MO 63556
Bristol Manor 715 N 22nd St Unionville, MO 63565
High Hope Employment Services Inc. 611 W 3rd St. #1 Milan, MO 63556
Putnam County Care Center 1814 Oak St. Unionville, MO 63565
Missouri Family Support Division 103 Forrest Dr. Brookfield, MO 64628
Pearl’s II 611 N College St Princeton, MO 64673
Harrison County Community Hospital 2600 Miller St. Bethany, MO 64424
Spring Manor Group Home 212 Spring St. Carrollton, MO 64633
Wright Memorial Hospital 191 Iowa Blvd Trenton, MO 64683
Caldwell County Food Pantry 202 N Davis Hamilton, MO
Carroll County Memorial Hospital 1502 N Jefferson St Carrollton, MO 64633
Open Bible Church Ministries 718 W Berry Hamilton, MO
Pershing Memorial Hospital 130 E Lockling Ave
Community Food Pantry of Grundy County 1703 Harris Ave
Trenton, MO
Hale, MO 64643
Linn County Food Pantry 122 W Clark Brookfield, MO
Carroll County H.E.L.P. Services 14 W Washington Ave. Carrollton, MO 64633
Putnam County Food Pantry 1509 Main St Unionville, MO Patonsburg Multi-Purpose Center 401 Chestnut Patonsburg, MO Harrison County Food Pantry 608 N 25th St Bethany, MO Livingston County Food Pantry 403 Locust Chillicothe, MO Life Center Food Pantry 820 Elm St Chillicothe, MO Mercer County Food Pantry 804 E Main Princeton, MO Sullivan County Food Pantry 106 W 2nd Milan, MO
Carroll County Pantry 905 S Main St Carrollton, MO 64633 Our Place Mercer, MO City Hall Mercer Missouri Transportation Providers Cameron Cab 10801 NW Oregon Dr. Cameron, MO 64429 OATS Transportation Inc. 607 US-36 BUS Chillicothe, MO 64601 Jefferson Lines Kwik Zone 4126 Miller St. Bethany, MO 64424
Chariton County Cupboard 420 Breckenridge Brunswick, MO 65236
Best 3 Taxi 608 Main St. Bethany, MO 64424 Barbara’s Taxi Service 1204 S 15th St. Bethany, MO 64424
Salisbury Food Pantry 311 E Paterson Salisbury, MO 65281
Country Pride Transportation 1423 Chestnut St. Trenton, MO 64683
Hale United Methodist Food Pantry 409 E Sunset Dr
Wize Guyz Taxi 801-899 Calhoun St
Chillicothe, MO 64601
Additionally, emails were sent to all city halls in the eleven-county district with a copy of the flyer, link to the online survey, and a printable version of the survey.
Press Release: The Green Hills Regional Planning Commission is currently conducting a survey to determine the public transportation needs in our 11-county region. This plan encompasses the following counties: Caldwell, Carroll, Chariton, Daviess, Grundy. Hamilton, Linn, Livingston, Mercer, Putnam, and Sullivan County. This data will be incorporated into the Public Transit-Human Services Transportation Plan for this region. This plan is specifically designed to address the public transportation needs currently available in our region and set priorities regarding future planning. The plan requires the specific input of individuals that are most likely to need public transportation: the elderly, disabled persons, and low-income individuals. Your help would be invaluable in determining the needs of this region, especially if you or someone in your household utilizes public transit. It should also be emphasized that the goal of this plan is to identify needs in public transportation, but also to prioritize where the region would benefit from changes. The link can be found on the Green Hills Regional Planning Commission’s website (GHRPC.com) and is listed below. htps://www.surveymonkey.com/r/HGHHBR7 For more information, please contact:
Amanda George Assistant Planner TAC & SEMA Green Hills Regional Planning Commission (660) 359-5636 ext. 25 amanda@ghrpc.org
This press release was sent to all newspapers in the region
Press Release: Public Meetings Being Held to Discuss Regional Public Transportation The Green Hills Regional Planning Commission is currently writing the Public Transit-Human Services Transportation Plan. The purpose of this plan is to determine the public transportation needs in our 11-county region. The area included in this study encompasses: Caldwell, Carroll, Chariton, Daviess, Grundy, Hamilton, Linn, Livingston, Mercer, Putnam, and Sullivan County. This plan is specifically designed to address the public transportation needs currently available in our region and set priorities regarding future planning. The plan requires the specific input of individuals that are most likely to need public transportation: the elderly, disabled persons, and low-income individuals. It should be emphasized that the goal of this plan is to identify needs in public transportation, and to prioritize where the region would benefit from changes. There will be public meetings held to give all interested parties the opportunity to participate in the planning process. Input from the public is welcome. If an interested party is unable to atend the public meetings, they may contact the Green Hills Regional Planning Commission directly. All reasonable comments made either in person or at a meeting will be incorporated into the plan. Public Meetings: Mercer County Senior Center 110 N Broadway St Princeton, MO 64673 September 8 11-12:30 PM Trenton City Hall 1100 Main St. Trenton, MO September 19th 1-2 PM
Chillicothe City Hall 715 Washington St. Chillicothe, MO September 20th 1-2 PM Carrollton Public Library (Boardroom) 1 N Folger St. Carrollton, MO September 22nd 1-2 PM For more information or to make a comment about public transportation in the region, please contact Amanda at the Green Hills Regional Planning Commission at (660) 359-5636 ext. 25 or amanda@ghrpc.org. -This was sent to newspapers and radio stations in this region on 9/5/2023
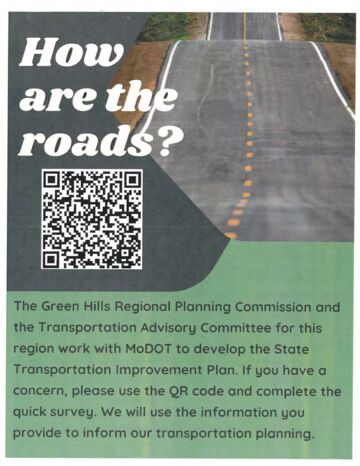
The Flyer sent out to advertise the online Survey:
More from transportation
-
 Regional Transportation Plan (Updated 2024)
April 29, 2026
-
 Transportation Advisory Committee Agenda, January 30, 2025
January 30, 2025
-
 OATS Transit Newsletter, January 2025
January 2025
-
 How Are the Roads? Survey Flyer
August 19, 2024
-
 Transportation Advisory Committee Minutes, June 2024
June 27, 2024