
Council Agenda item 10A
Staff Reports: City Manager; Treasurer; Clerk; Planning and Zoning; Department of Public Works, on PTO, no report; Police; Engineer, on PTO, no report
City Council, Monday, June 23, 2025
Download these 43 pages, 2.2 MB Whole packet, 178 pages, 14.7 MB
Page 83
Text of page 83
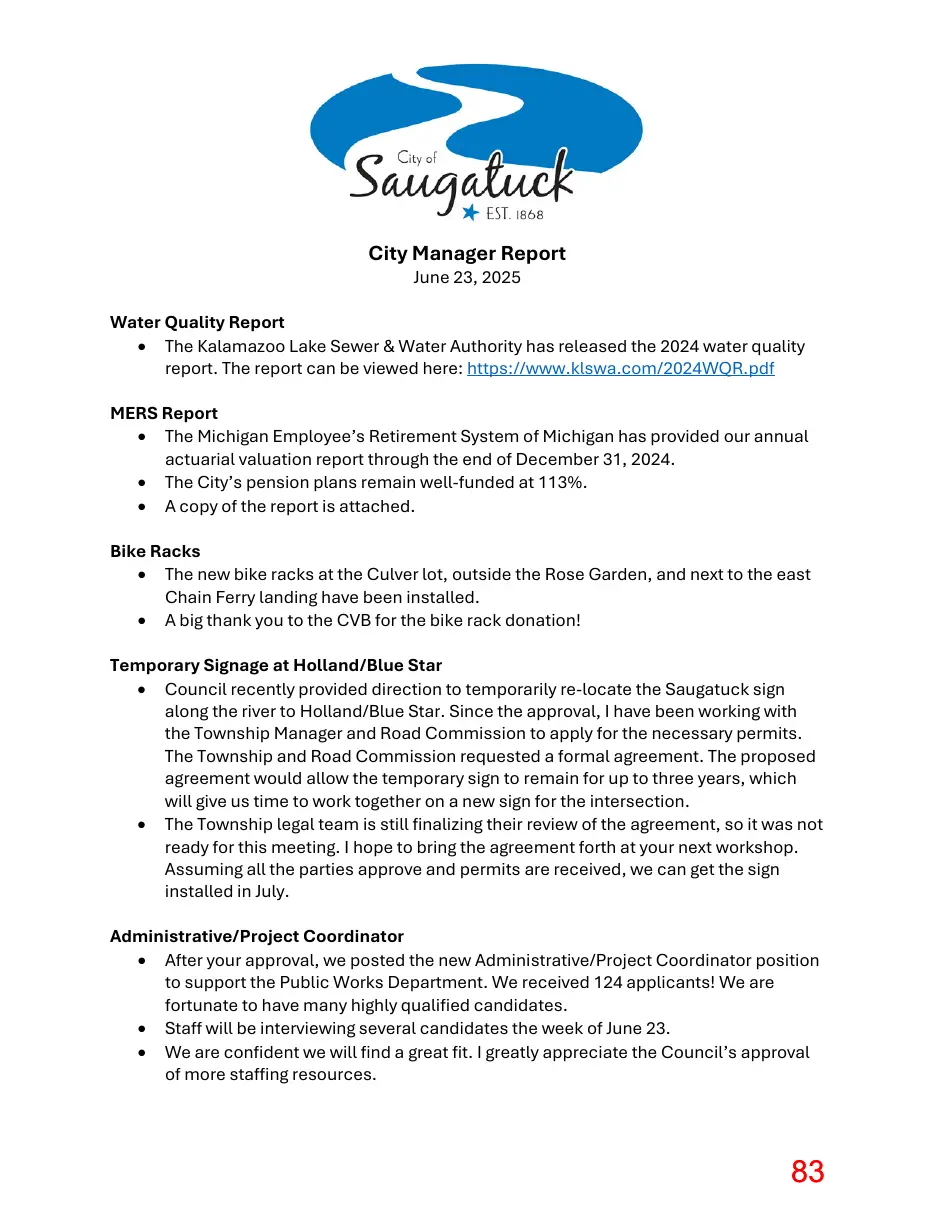
City Manager Report June 23, 2025
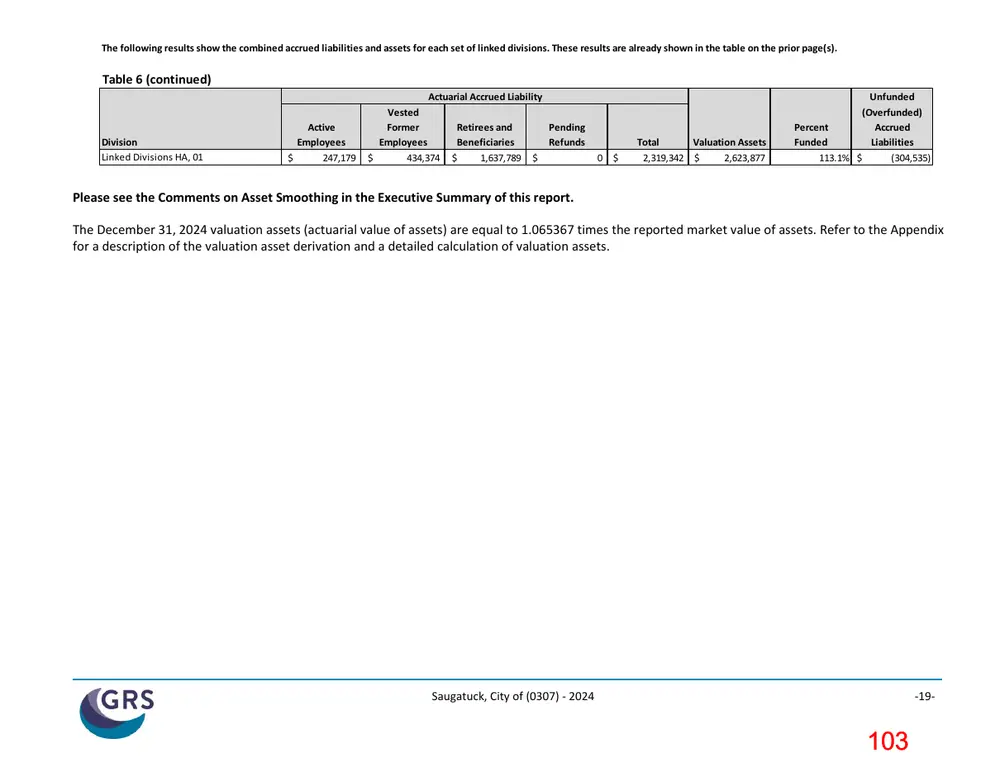
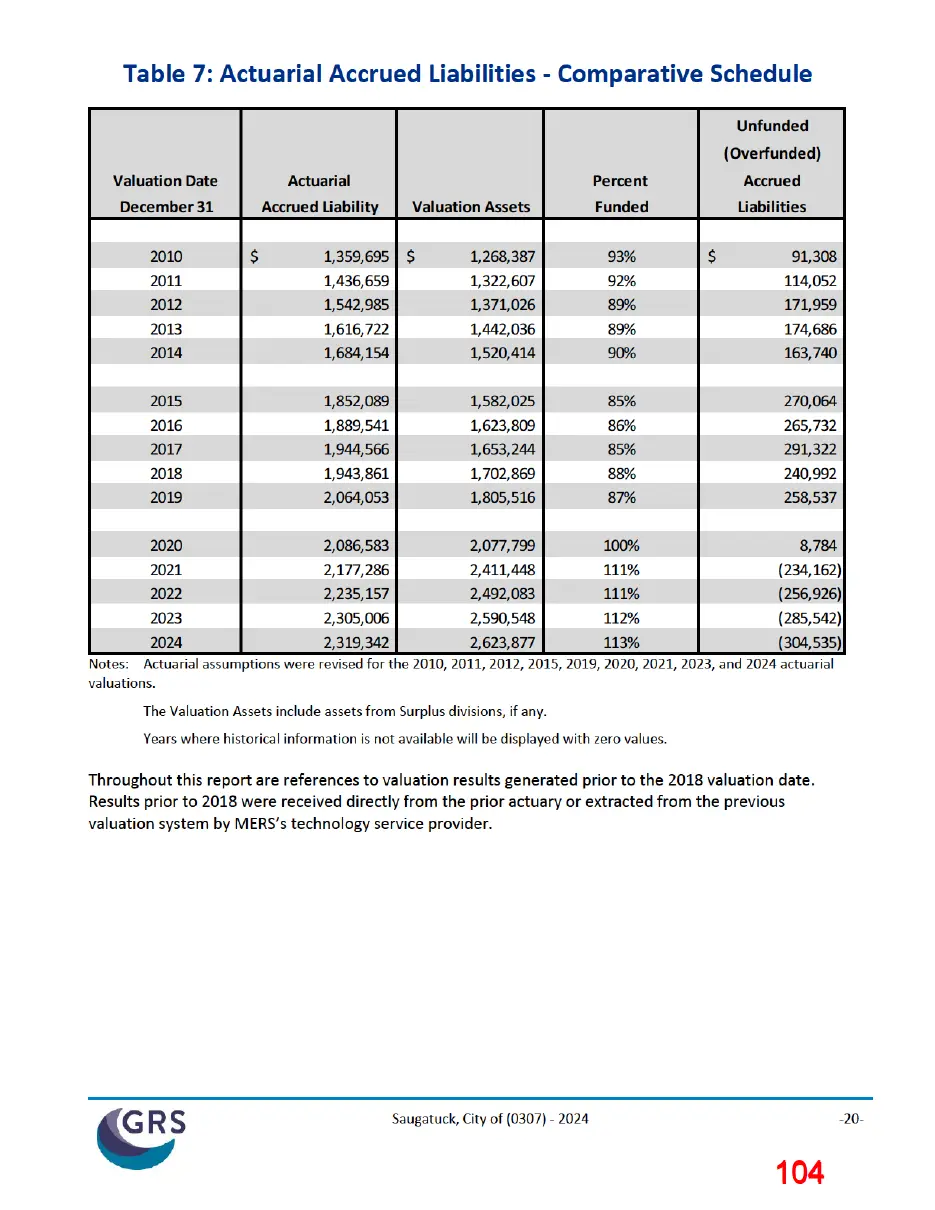
Water Quality Report • The Kalamazoo Lake Sewer & Water Authority has released the 2024 water quality report. The report can be viewed here: https://www.klswa.com/2024WQR.pdf MERS Report • The Michigan Employee’s Retirement System of Michigan has provided our annual actuarial valuation report through the end of December 31, 2024. • The City’s pension plans remain well-funded at 113%. • A copy of the report is attached. Bike Racks • The new bike racks at the Culver lot, outside the Rose Garden, and next to the east Chain Ferry landing have been installed. • A big thank you to the CVB for the bike rack donation! Temporary Signage at Holland/Blue Star • Council recently provided direction to temporarily re-locate the Saugatuck sign along the river to Holland/Blue Star. Since the approval, I have been working with the Township Manager and Road Commission to apply for the necessary permits. The Township and Road Commission requested a formal agreement. The proposed agreement would allow the temporary sign to remain for up to three years, which will give us time to work together on a new sign for the intersection. • The Township legal team is still finalizing their review of the agreement, so it was not ready for this meeting. I hope to bring the agreement forth at your next workshop. Assuming all the parties approve and permits are received, we can get the sign installed in July. Administrative/Project Coordinator • After your approval, we posted the new Administrative/Project Coordinator position to support the Public Works Department. We received 124 applicants! We are fortunate to have many highly qualified candidates. • Staff will be interviewing several candidates the week of June 23. • We are confident we will find a great fit. I greatly appreciate the Council’s approval of more staffing resources.
Page 84
Text of page 84
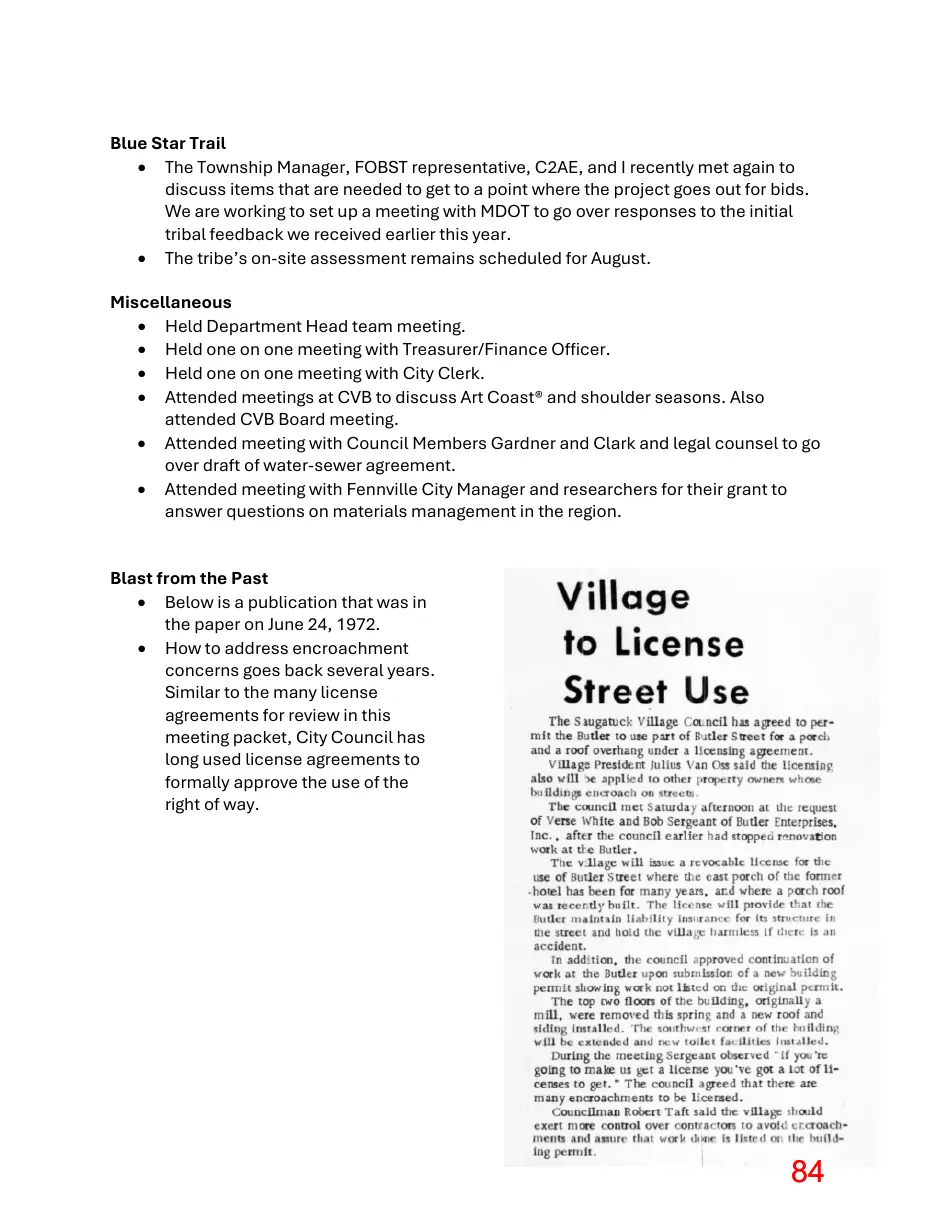
Blue Star Trail • The Township Manager, FOBST representative, C2AE, and I recently met again to discuss items that are needed to get to a point where the project goes out for bids. We are working to set up a meeting with MDOT to go over responses to the initial tribal feedback we received earlier this year. • The tribe’s on-site assessment remains scheduled for August. Miscellaneous • Held Department Head team meeting. • Held one on one meeting with Treasurer/Finance Officer. • Held one on one meeting with City Clerk. • Attended meetings at CVB to discuss Art Coast® and shoulder seasons. Also attended CVB Board meeting. • Attended meeting with Council Members Gardner and Clark and legal counsel to go over draft of water-sewer agreement. • Attended meeting with Fennville City Manager and researchers for their grant to answer questions on materials management in the region. Blast from the Past • Below is a publication that was in the paper on June 24, 1972. • How to address encroachment concerns goes back several years. Similar to the many license agreements for review in this meeting packet, City Council has long used license agreements to formally approve the use of the right of way.
Page 85
Text of page 85
Municipal Employees’ Retirement System of Michigan Annual Actuarial Valuation Report December 31, 2024 - Saugatuck, City of (0307)
Page 86
Text of page 86
Spring 2025
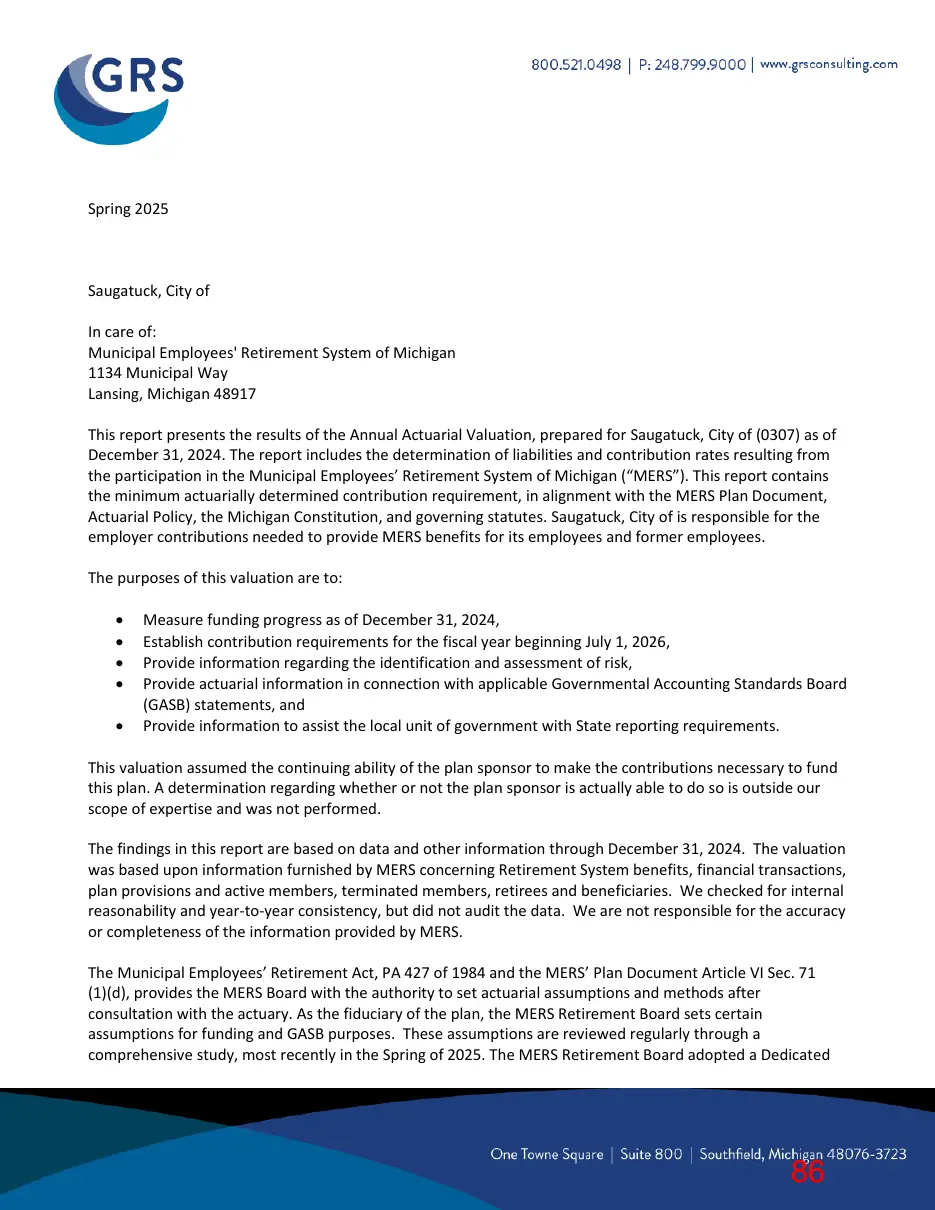
Saugatuck, City of In care of: Municipal Employees' Retirement System of Michigan 1134 Municipal Way Lansing, Michigan 48917 This report presents the results of the Annual Actuarial Valuation, prepared for Saugatuck, City of (0307) as of December 31, 2024. The report includes the determination of liabilities and contribution rates resulting from the participation in the Municipal Employees’ Retirement System of Michigan (“MERS”). This report contains the minimum actuarially determined contribution requirement, in alignment with the MERS Plan Document, Actuarial Policy, the Michigan Constitution, and governing statutes. Saugatuck, City of is responsible for the employer contributions needed to provide MERS benefits for its employees and former employees. The purposes of this valuation are to: • • • • •
Measure funding progress as of December 31, 2024, Establish contribution requirements for the fiscal year beginning July 1, 2026, Provide information regarding the identification and assessment of risk, Provide actuarial information in connection with applicable Governmental Accounting Standards Board (GASB) statements, and Provide information to assist the local unit of government with State reporting requirements.
This valuation assumed the continuing ability of the plan sponsor to make the contributions necessary to fund this plan. A determination regarding whether or not the plan sponsor is actually able to do so is outside our scope of expertise and was not performed. The findings in this report are based on data and other information through December 31, 2024. The valuation was based upon information furnished by MERS concerning Retirement System benefits, financial transactions, plan provisions and active members, terminated members, retirees and beneficiaries. We checked for internal reasonability and year-to-year consistency, but did not audit the data. We are not responsible for the accuracy or completeness of the information provided by MERS. The Municipal Employees’ Retirement Act, PA 427 of 1984 and the MERS’ Plan Document Article VI Sec. 71 (1)(d), provides the MERS Board with the authority to set actuarial assumptions and methods after consultation with the actuary. As the fiduciary of the plan, the MERS Retirement Board sets certain assumptions for funding and GASB purposes. These assumptions are reviewed regularly through a comprehensive study, most recently in the Spring of 2025. The MERS Retirement Board adopted a Dedicated
Page 87
Text of page 87
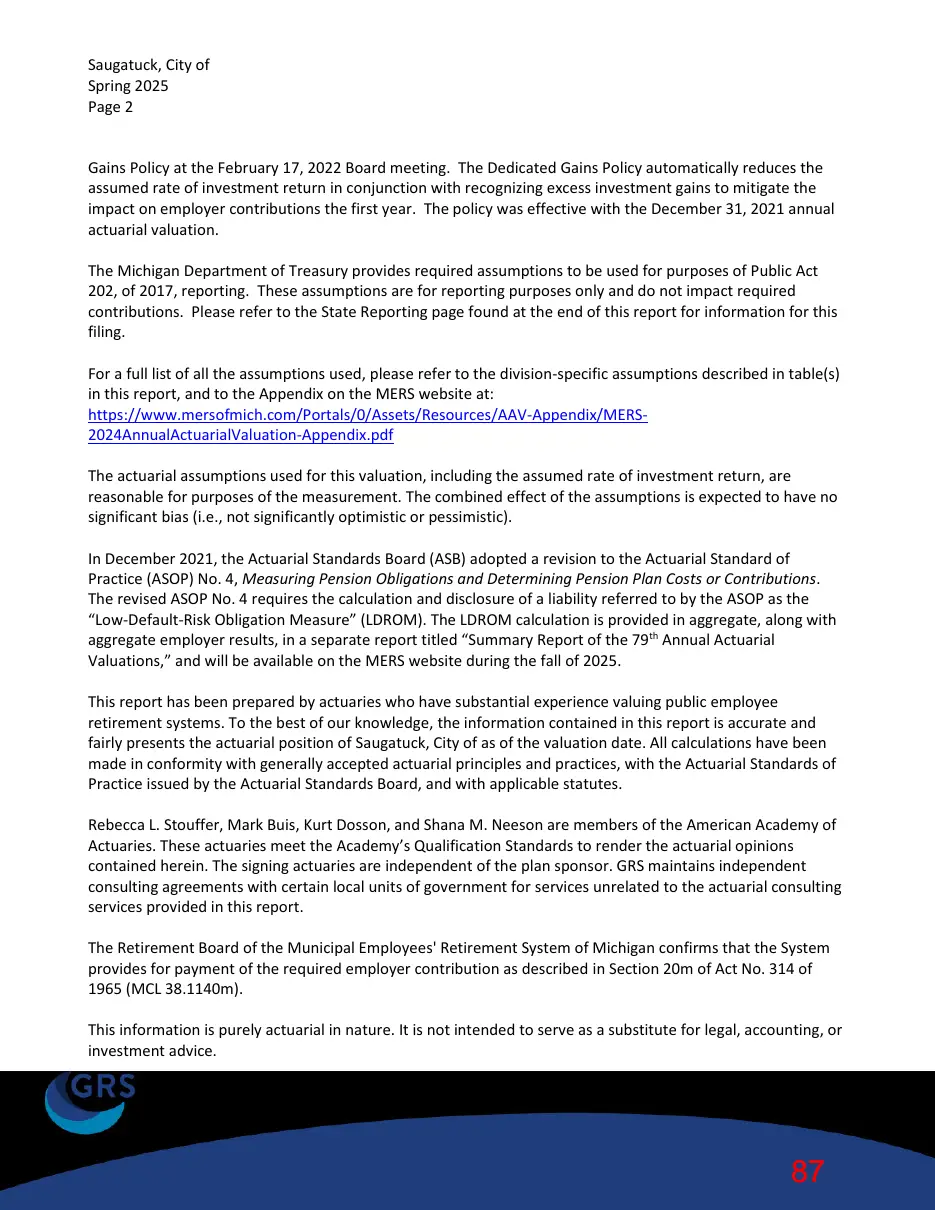
Saugatuck, City of Spring 2025 Page 2
Gains Policy at the February 17, 2022 Board meeting. The Dedicated Gains Policy automatically reduces the assumed rate of investment return in conjunction with recognizing excess investment gains to mitigate the impact on employer contributions the first year. The policy was effective with the December 31, 2021 annual actuarial valuation. The Michigan Department of Treasury provides required assumptions to be used for purposes of Public Act 202, of 2017, reporting. These assumptions are for reporting purposes only and do not impact required contributions. Please refer to the State Reporting page found at the end of this report for information for this filing. For a full list of all the assumptions used, please refer to the division-specific assumptions described in table(s) in this report, and to the Appendix on the MERS website at: https://www.mersofmich.com/Portals/0/Assets/Resources/AAV-Appendix/MERS2024AnnualActuarialValuation-Appendix.pdf The actuarial assumptions used for this valuation, including the assumed rate of investment return, are reasonable for purposes of the measurement. The combined effect of the assumptions is expected to have no significant bias (i.e., not significantly optimistic or pessimistic). In December 2021, the Actuarial Standards Board (ASB) adopted a revision to the Actuarial Standard of Practice (ASOP) No. 4, Measuring Pension Obligations and Determining Pension Plan Costs or Contributions. The revised ASOP No. 4 requires the calculation and disclosure of a liability referred to by the ASOP as the “Low-Default-Risk Obligation Measure” (LDROM). The LDROM calculation is provided in aggregate, along with aggregate employer results, in a separate report titled “Summary Report of the 79th Annual Actuarial Valuations,” and will be available on the MERS website during the fall of 2025. This report has been prepared by actuaries who have substantial experience valuing public employee retirement systems. To the best of our knowledge, the information contained in this report is accurate and fairly presents the actuarial position of Saugatuck, City of as of the valuation date. All calculations have been made in conformity with generally accepted actuarial principles and practices, with the Actuarial Standards of Practice issued by the Actuarial Standards Board, and with applicable statutes. Rebecca L. Stouffer, Mark Buis, Kurt Dosson, and Shana M. Neeson are members of the American Academy of Actuaries. These actuaries meet the Academy’s Qualification Standards to render the actuarial opinions contained herein. The signing actuaries are independent of the plan sponsor. GRS maintains independent consulting agreements with certain local units of government for services unrelated to the actuarial consulting services provided in this report. The Retirement Board of the Municipal Employees' Retirement System of Michigan confirms that the System provides for payment of the required employer contribution as described in Section 20m of Act No. 314 of 1965 (MCL 38.1140m). This information is purely actuarial in nature. It is not intended to serve as a substitute for legal, accounting, or investment advice.
Page 88
Text of page 88
Saugatuck, City of Spring 2025 Page 3
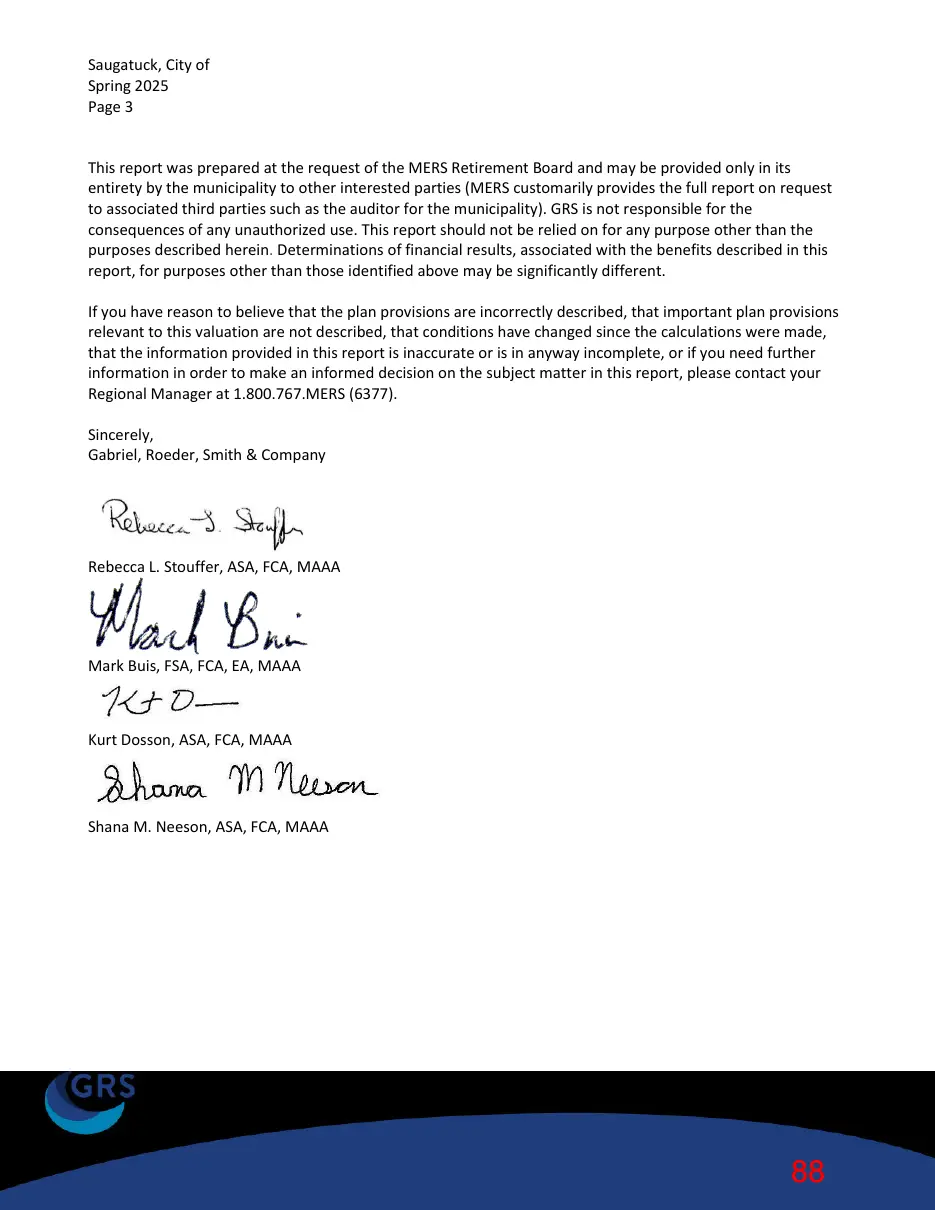
This report was prepared at the request of the MERS Retirement Board and may be provided only in its entirety by the municipality to other interested parties (MERS customarily provides the full report on request to associated third parties such as the auditor for the municipality). GRS is not responsible for the consequences of any unauthorized use. This report should not be relied on for any purpose other than the purposes described herein. Determinations of financial results, associated with the benefits described in this report, for purposes other than those identified above may be significantly different. If you have reason to believe that the plan provisions are incorrectly described, that important plan provisions relevant to this valuation are not described, that conditions have changed since the calculations were made, that the information provided in this report is inaccurate or is in anyway incomplete, or if you need further information in order to make an informed decision on the subject matter in this report, please contact your Regional Manager at 1.800.767.MERS (6377). Sincerely, Gabriel, Roeder, Smith & Company
Rebecca L. Stouffer, ASA, FCA, MAAA
Mark Buis, FSA, FCA, EA, MAAA
Kurt Dosson, ASA, FCA, MAAA
Shana M. Neeson, ASA, FCA, MAAA
Page 89
Text of page 89
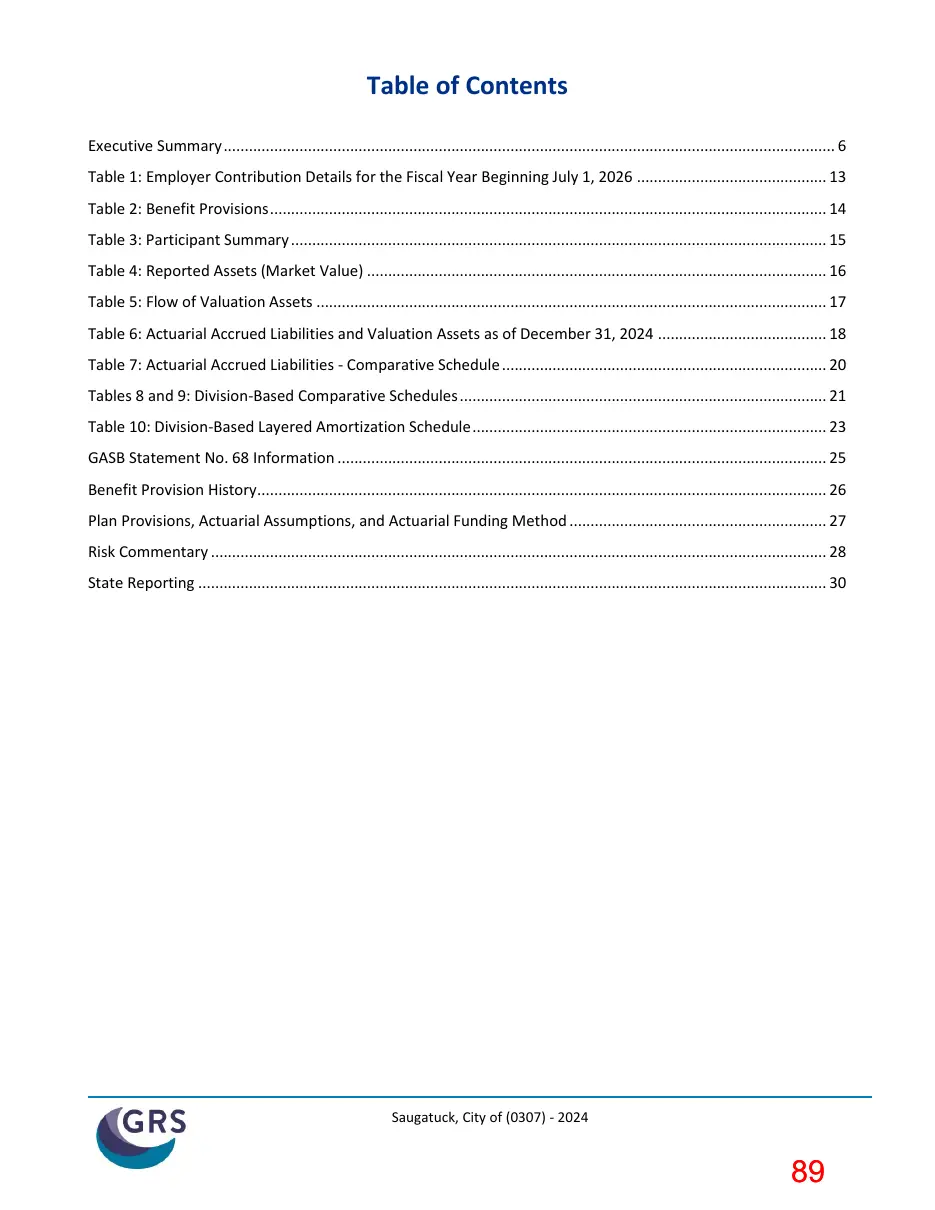
Table of Contents Executive Summary ................................................................................................................................................. 6 Table 1: Employer Contribution Details for the Fiscal Year Beginning July 1, 2026 ............................................. 13 Table 2: Benefit Provisions .................................................................................................................................... 14 Table 3: Participant Summary ............................................................................................................................... 15 Table 4: Reported Assets (Market Value) ............................................................................................................. 16 Table 5: Flow of Valuation Assets ......................................................................................................................... 17 Table 6: Actuarial Accrued Liabilities and Valuation Assets as of December 31, 2024 ........................................ 18 Table 7: Actuarial Accrued Liabilities - Comparative Schedule ............................................................................. 20 Tables 8 and 9: Division-Based Comparative Schedules ....................................................................................... 21 Table 10: Division-Based Layered Amortization Schedule .................................................................................... 23 GASB Statement No. 68 Information .................................................................................................................... 25 Benefit Provision History ....................................................................................................................................... 26 Plan Provisions, Actuarial Assumptions, and Actuarial Funding Method ............................................................. 27 Risk Commentary .................................................................................................................................................. 28 State Reporting ..................................................................................................................................................... 30
Saugatuck, City of (0307) - 2024
Page 90
Text of page 90
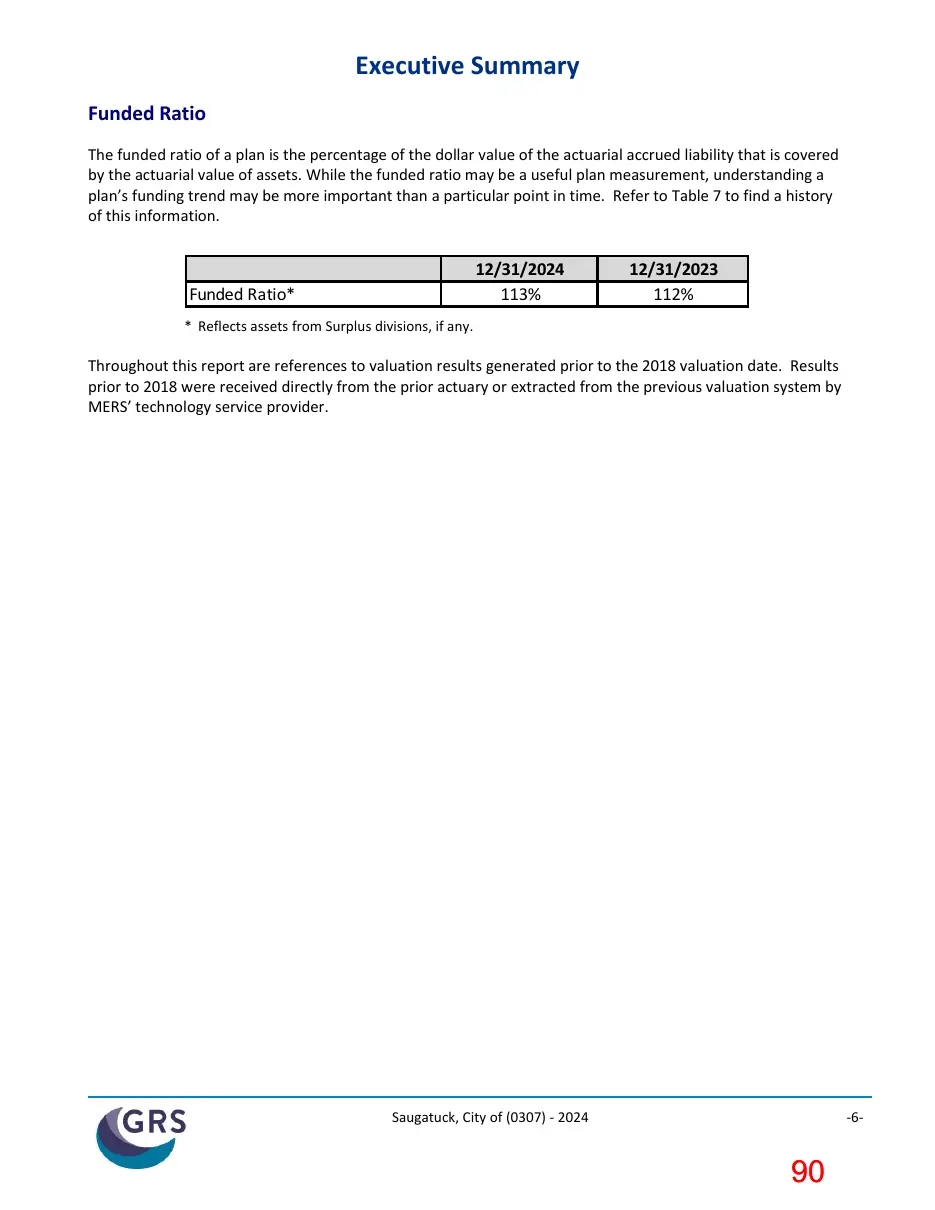
Executive Summary Funded Ratio The funded ratio of a plan is the percentage of the dollar value of the actuarial accrued liability that is covered by the actuarial value of assets. While the funded ratio may be a useful plan measurement, understanding a plan’s funding trend may be more important than a particular point in time. Refer to Table 7 to find a history of this information.
12/31/2024 113%
Funded Ratio*
12/31/2023 112%
* Reflects assets from Surplus divisions, if any.
Throughout this report are references to valuation results generated prior to the 2018 valuation date. Results prior to 2018 were received directly from the prior actuary or extracted from the previous valuation system by MERS’ technology service provider.
Saugatuck, City of (0307) - 2024
Page 91
Text of page 91
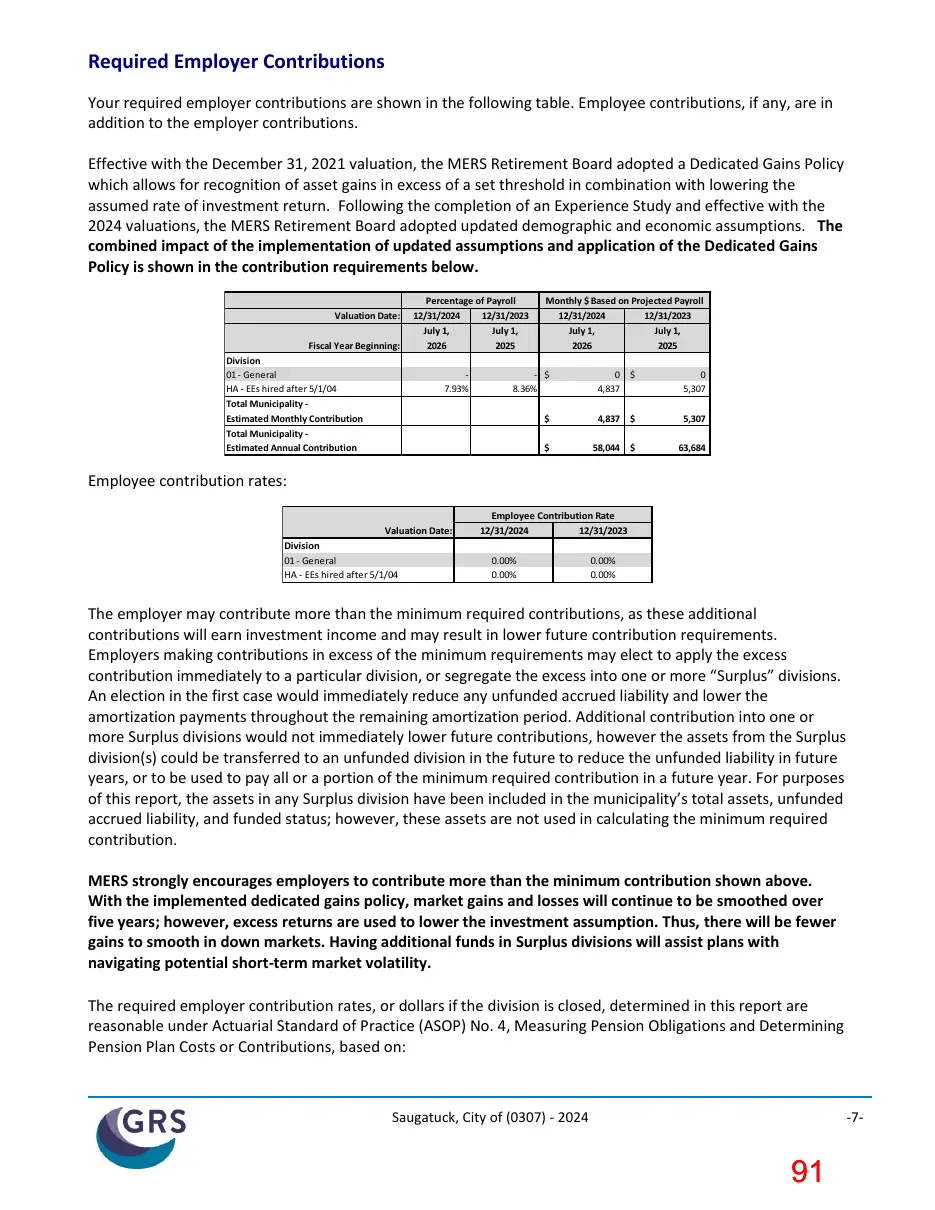
Required Employer Contributions Your required employer contributions are shown in the following table. Employee contributions, if any, are in addition to the employer contributions. Effective with the December 31, 2021 valuation, the MERS Retirement Board adopted a Dedicated Gains Policy which allows for recognition of asset gains in excess of a set threshold in combination with lowering the assumed rate of investment return. Following the completion of an Experience Study and effective with the 2024 valuations, the MERS Retirement Board adopted updated demographic and economic assumptions. The combined impact of the implementation of updated assumptions and application of the Dedicated Gains Policy is shown in the contribution requirements below. Valuation Date: Fiscal Year Beginning: Division 01 - General HA - EEs hired after 5/1/04 Total Municipality Estimated Monthly Contribution Total Municipality Estimated Annual Contribution
Percentage of Payroll 12/31/2024 12/31/2023 July 1, July 1, 2026 2025 7.93%
Monthly $ Based on Projected Payroll 12/31/2024 12/31/2023 July 1, July 1, 2026 2025
- $ 8.36%
0 $ 4,837
0 5,307
4,837 $
5,307
58,044 $
63,684
Employee contribution rates: Valuation Date: Division 01 - General HA - EEs hired after 5/1/04
Employee Contribution Rate 12/31/2024 12/31/2023 0.00% 0.00%
0.00% 0.00%
The employer may contribute more than the minimum required contributions, as these additional contributions will earn investment income and may result in lower future contribution requirements. Employers making contributions in excess of the minimum requirements may elect to apply the excess contribution immediately to a particular division, or segregate the excess into one or more “Surplus” divisions. An election in the first case would immediately reduce any unfunded accrued liability and lower the amortization payments throughout the remaining amortization period. Additional contribution into one or more Surplus divisions would not immediately lower future contributions, however the assets from the Surplus division(s) could be transferred to an unfunded division in the future to reduce the unfunded liability in future years, or to be used to pay all or a portion of the minimum required contribution in a future year. For purposes of this report, the assets in any Surplus division have been included in the municipality’s total assets, unfunded accrued liability, and funded status; however, these assets are not used in calculating the minimum required contribution. MERS strongly encourages employers to contribute more than the minimum contribution shown above. With the implemented dedicated gains policy, market gains and losses will continue to be smoothed over five years; however, excess returns are used to lower the investment assumption. Thus, there will be fewer gains to smooth in down markets. Having additional funds in Surplus divisions will assist plans with navigating potential short-term market volatility. The required employer contribution rates, or dollars if the division is closed, determined in this report are reasonable under Actuarial Standard of Practice (ASOP) No. 4, Measuring Pension Obligations and Determining Pension Plan Costs or Contributions, based on:
Saugatuck, City of (0307) - 2024
Page 92
Text of page 92
The use of reasonable actuarial assumptions and cost methods; The use of reasonable amortization and asset valuation methods; and Application of the MERS funding policy which will accumulate sufficient assets to make benefit payments when due, assuming all assumptions will be realized, and the required employer contributions are made when due.
How and Why Do These Numbers Change? In a defined benefit plan, contributions vary from one annual actuarial valuation to the next as a result of the following:
Changes in benefit provisions (see Table 2); Changes in actuarial assumptions and methods (see the Appendix); and Experience of the plan (investment experience and demographic experience); this is the difference between actual experience of the plan and the actuarial assumptions.
These impacts are reflected in various tables in the report. For more information, please contact your Regional Manager.
Comments on Investment Rate of Return Assumption A defined benefit plan is funded by employer contributions, participant contributions, and investment earnings. Investment earnings have historically provided a significant portion of the funding. The larger the share of benefits being provided from investment returns, the smaller the required contributions, and vice versa. Determining the contributions required to prefund the promised retirement benefits requires an assumption of what investment earnings are expected to add to the fund over a long period of time. This is called the Investment Return Assumption. The MERS Investment Return Assumption is 6.93% per year. This, along with all other actuarial assumptions, is reviewed at least every five years in an Experience Study that compares the assumptions used against actual experience and recommends adjustments if necessary. If your municipality would like to explore contributions at lower assumed investment return assumptions, please review the “What If” projection scenarios later in this report.
Assumption and Method Changes in 2024 Effective February 17, 2022, the MERS Retirement Board adopted a dedicated gains policy that automatically lowers the assumed rate of investment return by using excess asset gains to mitigate large increases in required contributions to the Plan. Full details of this dedicated gains policy are available in the Actuarial Policy found on the MERS website. Some goals of the dedicated gains policy are to: • •
Provide a systematic approach to lower the assumed rate of investment return between experience studies; and Use excess gains to cover both the increase in normal cost and any increase in UAL payment the first contribution year after application (i.e., minimize the first-year impact (i.e., increase) in employer contributions).
The dedicated gains policy was implemented with the December 31, 2021 annual actuarial valuation and was reflected in the computed employer contribution amounts beginning in fiscal year 2023.
Saugatuck, City of (0307) - 2024
Page 93
Text of page 93
Investment performance measured for the one-year period ending December 31, 2024 resulted in no change to the assumed rate of investment return of 6.93%. On February 12, 2025, the MERS Retirement Board adopted the results of an Experience Study covering the period, January 1, 2019 through December 31, 2023. The study examined recent experience and trends, with consideration for the COVID-19 pandemic. The study resulted in incremental assumption updates, with limited impact on employer contributions and funded status, for most employers when results are measured on the new assumption basis. The results of this study are reflected in the December 31, 2024 annual actuarial valuations.
MI Local Retirement Grant Michigan lawmakers adopted Public Act 119 of 2023, which provided relief to local units of government with the most significant burden from qualified pension and retirement health benefit systems on their annual budget and revenues. As authorized under Public Act 119 of 2023, Section 990, the state pension and OPEB grants were awarded to eligible local governments in September 2024. A smaller number of municipalities qualified for the MI Local Retirement Grant than the Protecting MI Pension Grant Program of the previous year. Pension funds received by municipalities were deposited into the MERS trust during September 2024 and are reflected in this valuation.
Comments on Asset Smoothing To avoid dramatic spikes and dips in annual contribution requirements due to short-term fluctuations in asset markets, MERS applies a technique called asset smoothing. This spreads out each year’s investment gains or losses over the prior year and the following four years. After initial application of asset smoothing, remaining excess market gains are used to buy down the assumed rate of investment return and increase the level of valuation assets, to the extent allowed by the dedicated gains policy. This smoothing method is used to determine your actuarial value of assets (valuation assets), which is then used to determine both your funded ratio and your required contributions. The (smoothed) actuarial rate of return for 2024 was 3.79%, while the actual market rate of return was 7.28%. The actuarial rate of return is below the assumed rate of return, which will put upward pressure on the employer contribution requirements determined in this valuation. To see historical details of the market rate of return compared to the smoothed actuarial rate of return, refer to this report’s Appendix or view the “How Smoothing Works” video on the Defined Benefit resource page of the MERS website. As of December 31, 2024, the actuarial value of assets is 107% of market value due to asset smoothing. This means that there are deferred investment losses, which will put upward pressure on contributions in the short term. If the December 31, 2024 valuation results were based on market value instead of actuarial value: • •
The funded percent of your entire municipality would be 106% (instead of 113%); and Your total employer contribution requirement for the fiscal year starting July 1, 2026 would be $58,044 (instead of $58,044).
Alternate Scenarios to Estimate the Potential Volatility of Results ("What If Scenarios") The calculations in this report are based on assumptions about long-term economic and demographic Saugatuck, City of (0307) - 2024
Page 94
Text of page 94
behavior. These assumptions will never materialize in a given year, except by coincidence. Therefore, the results will vary from one year to the next. The volatility of the results depends upon the characteristics of the plan. For example: • • • •
Open divisions that have substantial assets compared to their active employee payroll will have more volatile employer contribution rates due to investment return fluctuations. Open divisions that have substantial accrued liability compared to their active employee payroll will have more volatile employer contribution rates due to demographic experience fluctuations. Small divisions will have more volatile contribution patterns than larger divisions because statistical fluctuations are relatively larger among small populations. Shorter amortization periods result in more volatile contribution patterns.
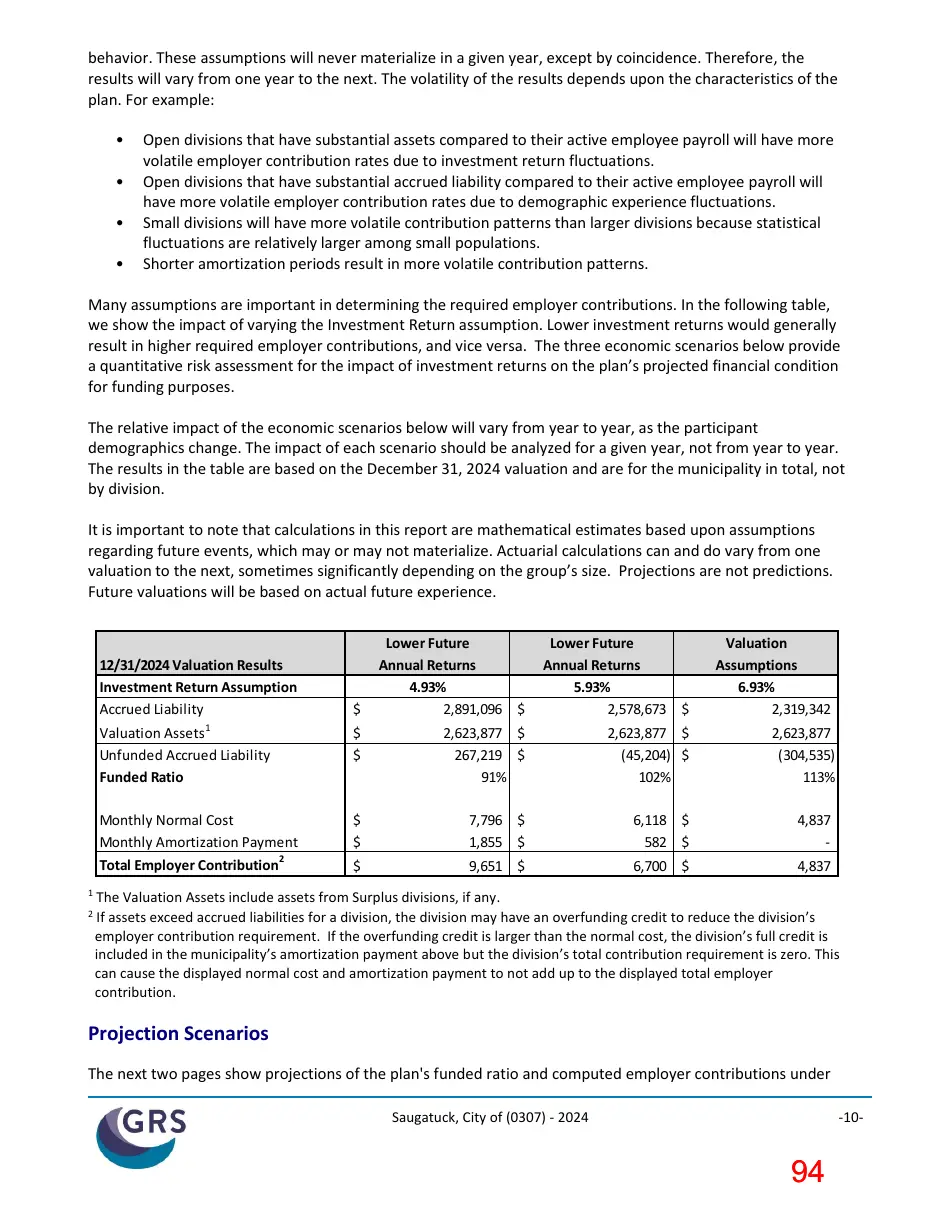
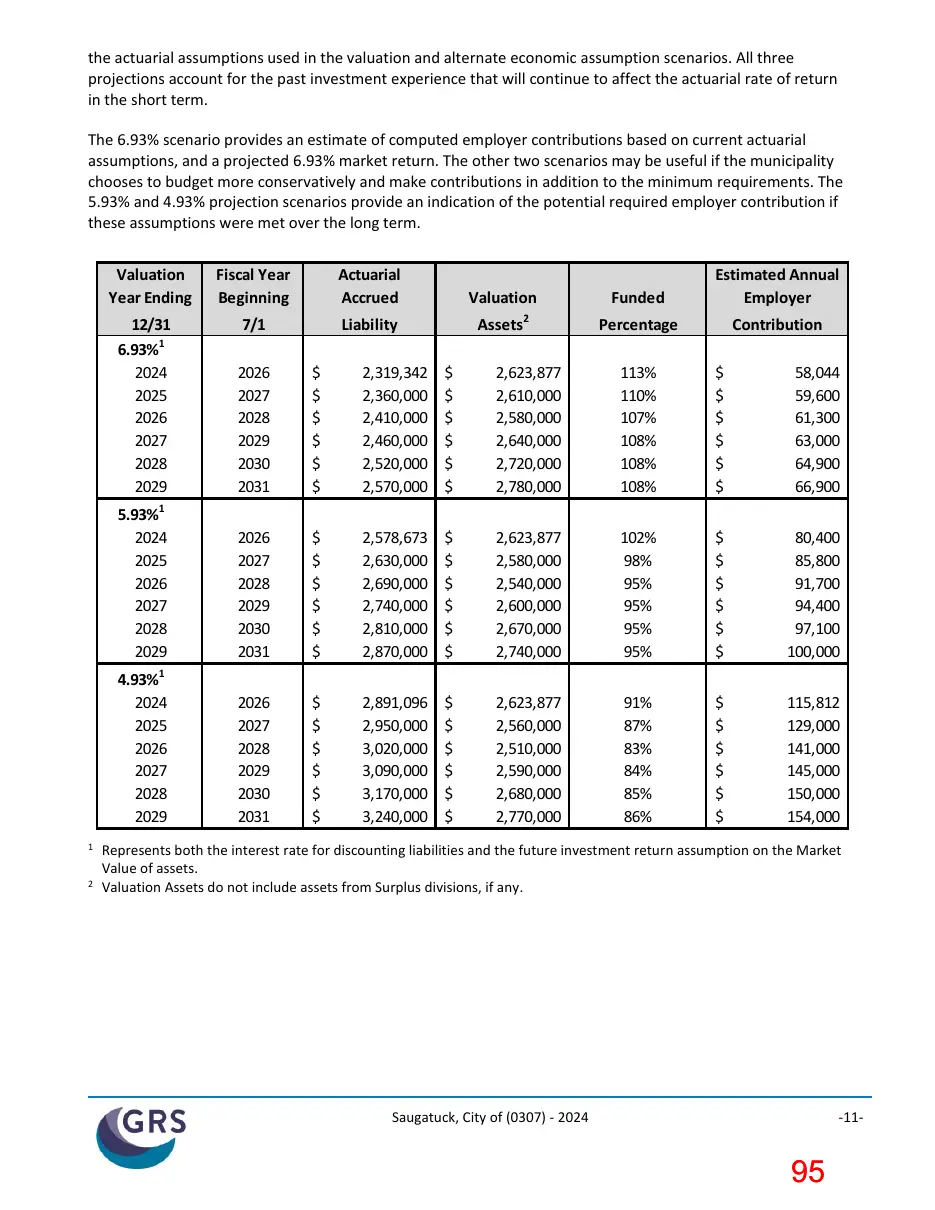
Many assumptions are important in determining the required employer contributions. In the following table, we show the impact of varying the Investment Return assumption. Lower investment returns would generally result in higher required employer contributions, and vice versa. The three economic scenarios below provide a quantitative risk assessment for the impact of investment returns on the plan’s projected financial condition for funding purposes. The relative impact of the economic scenarios below will vary from year to year, as the participant demographics change. The impact of each scenario should be analyzed for a given year, not from year to year. The results in the table are based on the December 31, 2024 valuation and are for the municipality in total, not by division. It is important to note that calculations in this report are mathematical estimates based upon assumptions regarding future events, which may or may not materialize. Actuarial calculations can and do vary from one valuation to the next, sometimes significantly depending on the group’s size. Projections are not predictions. Future valuations will be based on actual future experience.
12/31/2024 Valuation Results Investment Return Assumption Accrued Liability 1
1 2
Lower Future Annual Returns 4.93% 2,891,096 $
Lower Future Annual Returns 5.93% 2,578,673 $
Valuation Assumptions 6.93% 2,319,342
Valuation Assets Unfunded Accrued Liability Funded Ratio
2,623,877 $ 267,219 $ 91%
2,623,877 $ (45,204) $ 102%
2,623,877 (304,535) 113%
Monthly Normal Cost Monthly Amortization Payment Total Employer Contribution2
7,796 $ 1,855 $
6,118 $ 582 $
4,837 -
9,651 $
6,700 $
4,837
The Valuation Assets include assets from Surplus divisions, if any. If assets exceed accrued liabilities for a division, the division may have an overfunding credit to reduce the division’s employer contribution requirement. If the overfunding credit is larger than the normal cost, the division’s full credit is included in the municipality’s amortization payment above but the division’s total contribution requirement is zero. This can cause the displayed normal cost and amortization payment to not add up to the displayed total employer contribution.
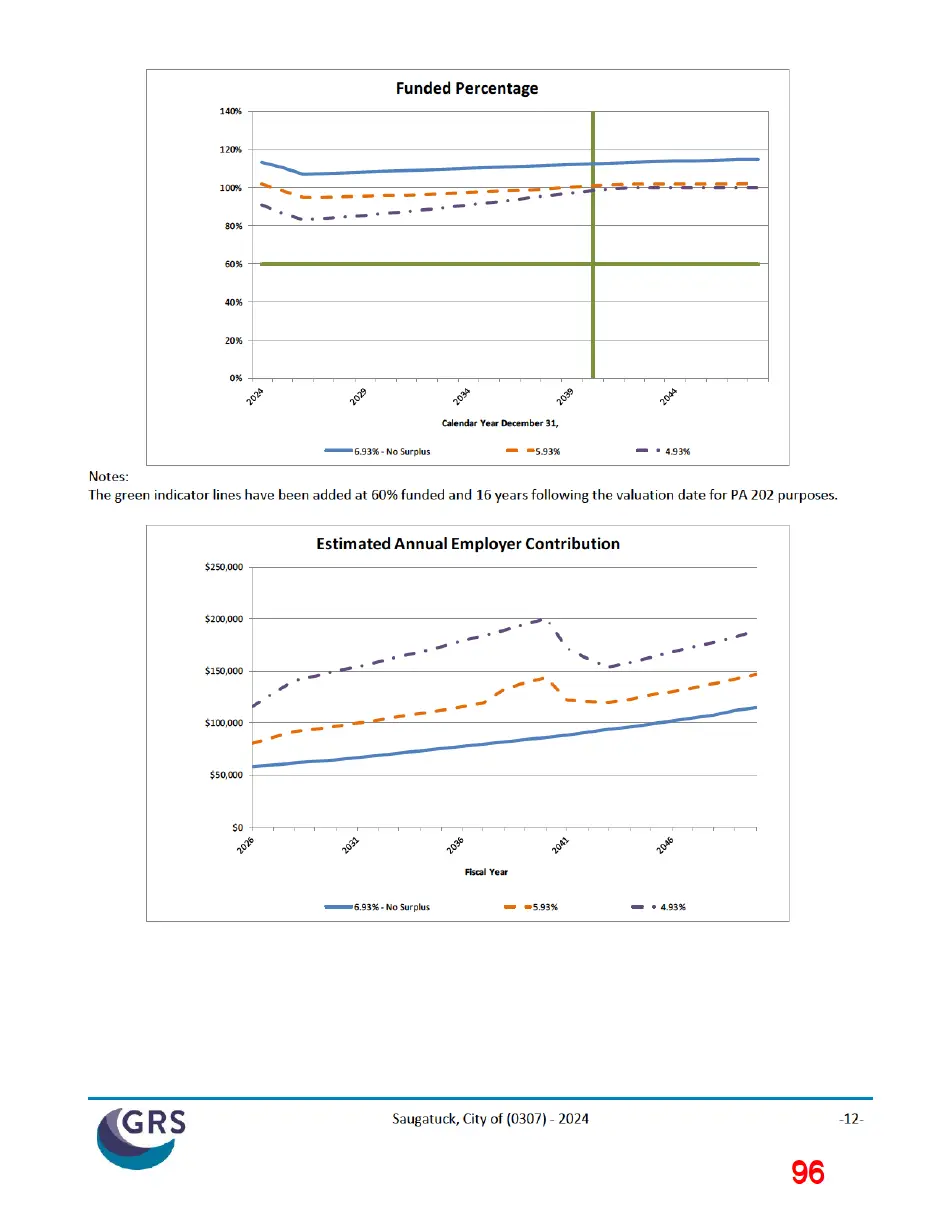
Projection Scenarios The next two pages show projections of the plan's funded ratio and computed employer contributions under Saugatuck, City of (0307) - 2024
-10-
Page 95
Text of page 95
the actuarial assumptions used in the valuation and alternate economic assumption scenarios. All three projections account for the past investment experience that will continue to affect the actuarial rate of return in the short term. The 6.93% scenario provides an estimate of computed employer contributions based on current actuarial assumptions, and a projected 6.93% market return. The other two scenarios may be useful if the municipality chooses to budget more conservatively and make contributions in addition to the minimum requirements. The 5.93% and 4.93% projection scenarios provide an indication of the potential required employer contribution if these assumptions were met over the long term.
Valuation Year Ending
Fiscal Year Beginning
Actuarial Accrued
7/1
Funded
Estimated Annual Employer
Percentage
Contribution
Valuation
12/31 6.93%1 2024 2025 2026 2027 2028 2029
Liability
Assets
2026 2027 2028 2029 2030 2031
2,319,342 2,360,000 2,410,000 2,460,000 2,520,000 2,570,000
2,623,877 2,610,000 2,580,000 2,640,000 2,720,000 2,780,000
113% 110% 107% 108% 108% 108%
58,044 59,600 61,300 63,000 64,900 66,900
5.93%1 2024 2025 2026 2027 2028 2029
2026 2027 2028 2029 2030 2031
2,578,673 2,630,000 2,690,000 2,740,000 2,810,000 2,870,000
2,623,877 2,580,000 2,540,000 2,600,000 2,670,000 2,740,000
102% 98% 95% 95% 95% 95%
80,400 85,800 91,700 94,400 97,100 100,000
4.93%1 2024 2025 2026 2027 2028 2029
2026 2027 2028 2029 2030 2031
2,891,096 2,950,000 3,020,000 3,090,000 3,170,000 3,240,000
2,623,877 2,560,000 2,510,000 2,590,000 2,680,000 2,770,000
91% 87% 83% 84% 85% 86%
115,812 129,000 141,000 145,000 150,000 154,000
Represents both the interest rate for discounting liabilities and the future investment return assumption on the Market Value of assets. 2 Valuation Assets do not include assets from Surplus divisions, if any.
Saugatuck, City of (0307) - 2024
-11-
Page 96
This page is a scanned image with no text layer. The PDF of these pages has it at full resolution.
Page 97
Text of page 97
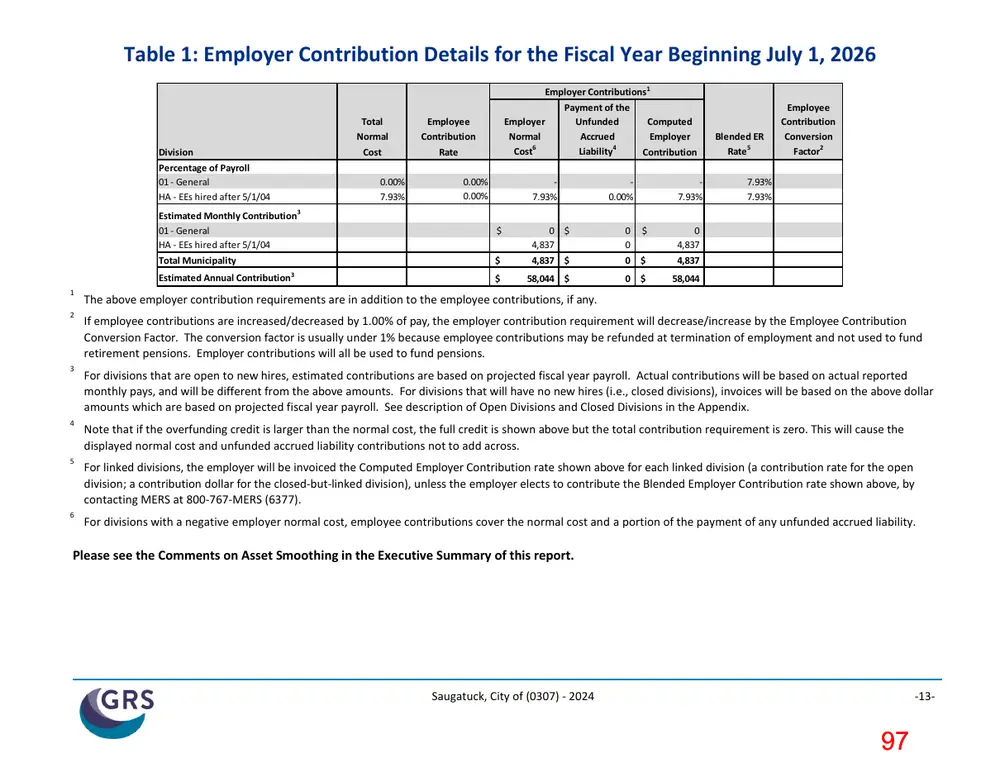
Table 1: Employer Contribution Details for the Fiscal Year Beginning July 1, 2026
Division Percentage of Payroll 01 - General HA - EEs hired after 5/1/04
1 2
Estimated Monthly Contribution3 01 - General HA - EEs hired after 5/1/04 Total Municipality Estimated Annual Contribution3
Total Normal
Employee Contribution
Cost
Rate
0.00% 7.93%
Employer Contributions1 Payment of the Employer Unfunded Computed Normal Accrued Employer Cost6 Liability4 Contribution
0.00% 0.00%
7.93% $
0.00%
7.93%
0 $ 4,837 4,837 $
0 $ 0 0 $
0 4,837 4,837
58,044 $
58,044
Blended ER Rate5
Employee Contribution Conversion Factor2
7.93% 7.93%
The above employer contribution requirements are in addition to the employee contributions, if any. If employee contributions are increased/decreased by 1.00% of pay, the employer contribution requirement will decrease/increase by the Employee Contribution Conversion Factor. The conversion factor is usually under 1% because employee contributions may be refunded at termination of employment and not used to fund retirement pensions. Employer contributions will all be used to fund pensions. For divisions that are open to new hires, estimated contributions are based on projected fiscal year payroll. Actual contributions will be based on actual reported monthly pays, and will be different from the above amounts. For divisions that will have no new hires (i.e., closed divisions), invoices will be based on the above dollar amounts which are based on projected fiscal year payroll. See description of Open Divisions and Closed Divisions in the Appendix. Note that if the overfunding credit is larger than the normal cost, the full credit is shown above but the total contribution requirement is zero. This will cause the displayed normal cost and unfunded accrued liability contributions not to add across. For linked divisions, the employer will be invoiced the Computed Employer Contribution rate shown above for each linked division (a contribution rate for the open division; a contribution dollar for the closed-but-linked division), unless the employer elects to contribute the Blended Employer Contribution rate shown above, by contacting MERS at 800-767-MERS (6377). For divisions with a negative employer normal cost, employee contributions cover the normal cost and a portion of the payment of any unfunded accrued liability.
Please see the Comments on Asset Smoothing in the Executive Summary of this report.
Saugatuck, City of (0307) - 2024
-13-
Page 98
Text of page 98
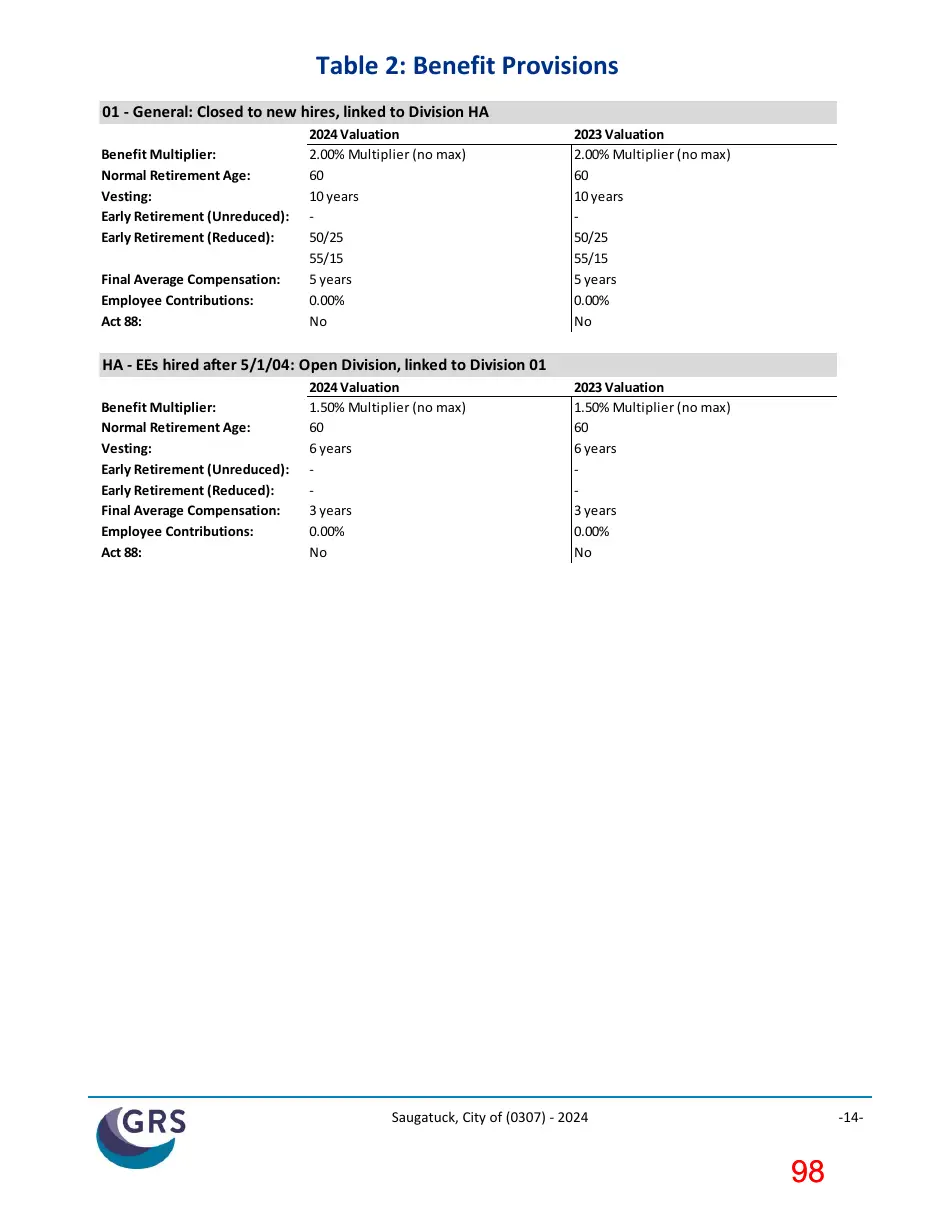
Table 2: Benefit Provisions 01 - General: Closed to new hires, linked to Division HA Benefit Multiplier: Normal Retirement Age: Vesting: Early Retirement (Unreduced): Early Retirement (Reduced): Final Average Compensation: Employee Contributions: Act 88:
2024 Valuation 2.00% Multiplier (no max) 60 10 years 50/25 55/15 5 years 0.00% No
2023 Valuation 2.00% Multiplier (no max) 60 10 years 50/25 55/15 5 years 0.00% No
HA - EEs hired after 5/1/04: Open Division, linked to Division 01 Benefit Multiplier: Normal Retirement Age: Vesting: Early Retirement (Unreduced): Early Retirement (Reduced): Final Average Compensation: Employee Contributions: Act 88:
2024 Valuation 1.50% Multiplier (no max) 60 6 years 3 years 0.00% No
2023 Valuation 1.50% Multiplier (no max) 60 6 years 3 years 0.00% No
Saugatuck, City of (0307) - 2024
-14-
Page 99
Text of page 99
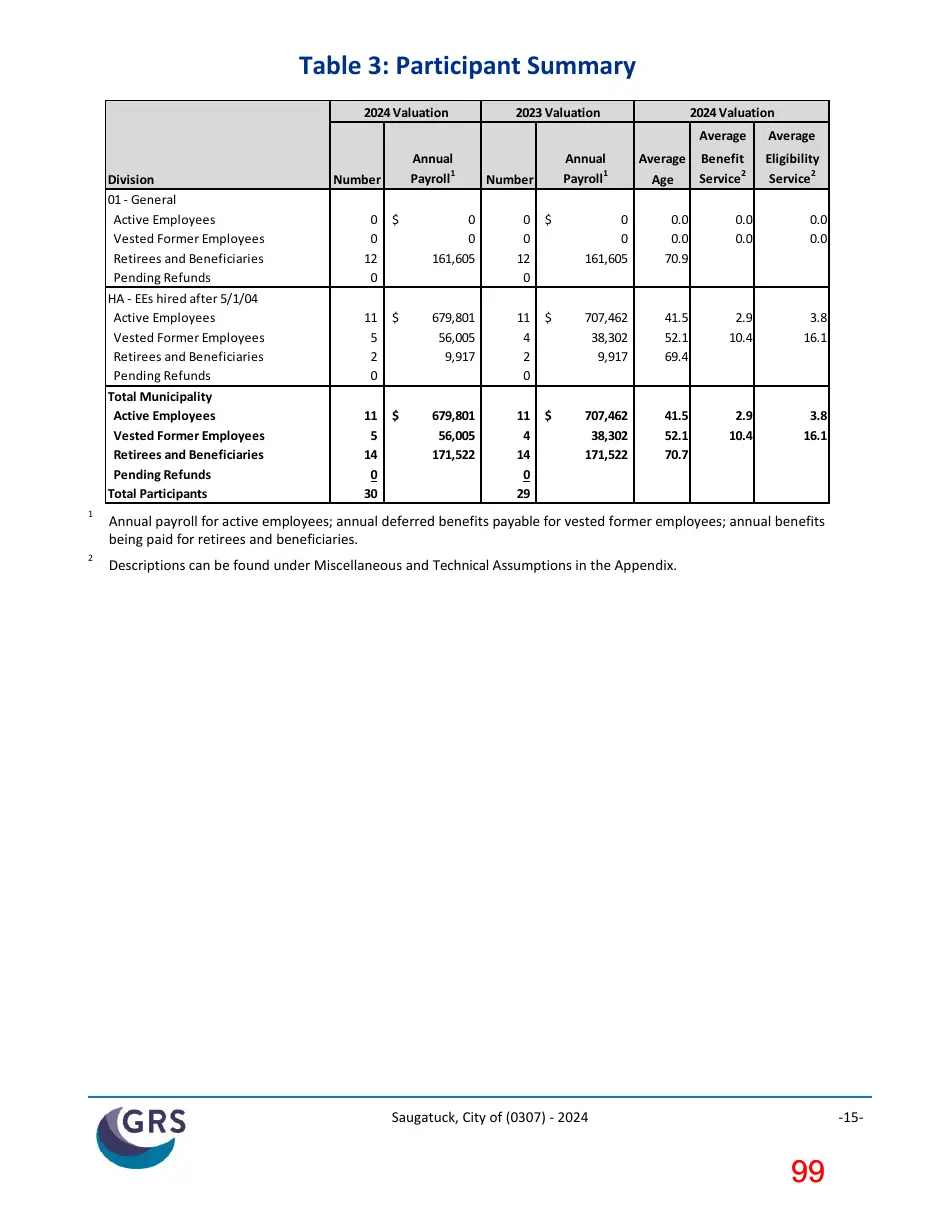
Table 3: Participant Summary
Division 01 - General Active Employees Vested Former Employees Retirees and Beneficiaries Pending Refunds HA - EEs hired after 5/1/04 Active Employees Vested Former Employees Retirees and Beneficiaries Pending Refunds Total Municipality Active Employees Vested Former Employees Retirees and Beneficiaries Pending Refunds Total Participants 1
2024 Valuation
2023 Valuation
Annual Payroll1
Annual Payroll1
Number
Number
2024 Valuation Average Age
Average
Average
Benefit Service 2
Eligibility Service 2
0 0 12 0
0 0 161,605
0 0 12 0
0 0 161,605
0.0 0.0 70.9
0.0 0.0
0.0 0.0
11 5 2 0
679,801 56,005 9,917
11 4 2 0
707,462 38,302 9,917
41.5 52.1 69.4
2.9 10.4
3.8 16.1
11 5 14 0 30
679,801 56,005 171,522
11 4 14 0 29
707,462 38,302 171,522
41.5 52.1 70.7
2.9 10.4
3.8 16.1
Annual payroll for active employees; annual deferred benefits payable for vested former employees; annual benefits being paid for retirees and beneficiaries. Descriptions can be found under Miscellaneous and Technical Assumptions in the Appendix.
Saugatuck, City of (0307) - 2024
-15-
Page 100
Text of page 100
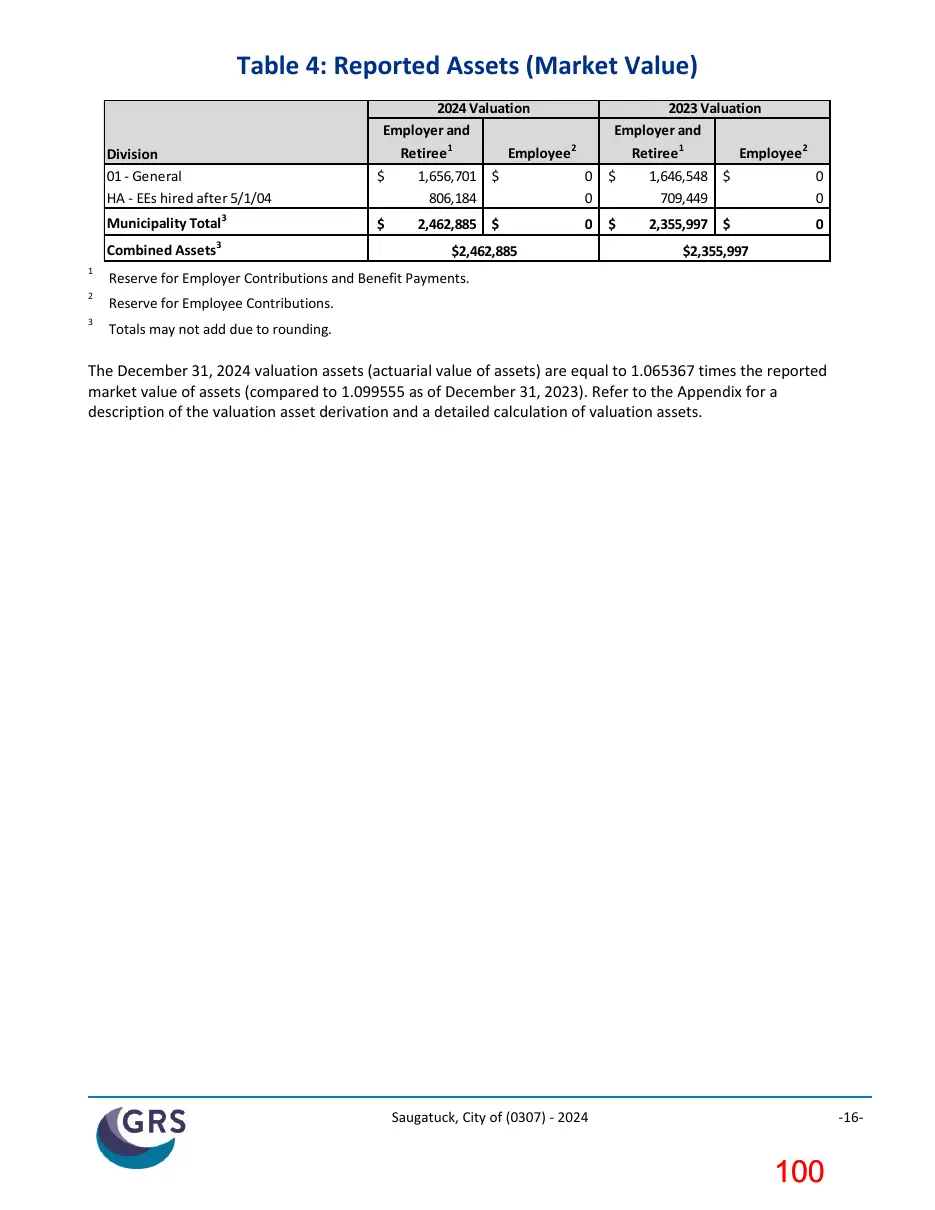
Table 4: Reported Assets (Market Value)
2 3
2023 Valuation Employer and Retiree 1 Employee 2
Division 01 - General HA - EEs hired after 5/1/04
1,656,701 $ 806,184
0 0
1,646,548 $ 709,449
0 0
Municipality Total3
2,462,885 $
2,355,997 $
Combined Assets 1
2024 Valuation Employer and Retiree 1 Employee2
$2,462,885
$2,355,997
Reserve for Employer Contributions and Benefit Payments. Reserve for Employee Contributions. Totals may not add due to rounding.
The December 31, 2024 valuation assets (actuarial value of assets) are equal to 1.065367 times the reported market value of assets (compared to 1.099555 as of December 31, 2023). Refer to the Appendix for a description of the valuation asset derivation and a detailed calculation of valuation assets.
Saugatuck, City of (0307) - 2024
-16-
Page 101
This page is a scanned image with no text layer. The PDF of these pages has it at full resolution.
Page 102
Text of page 102
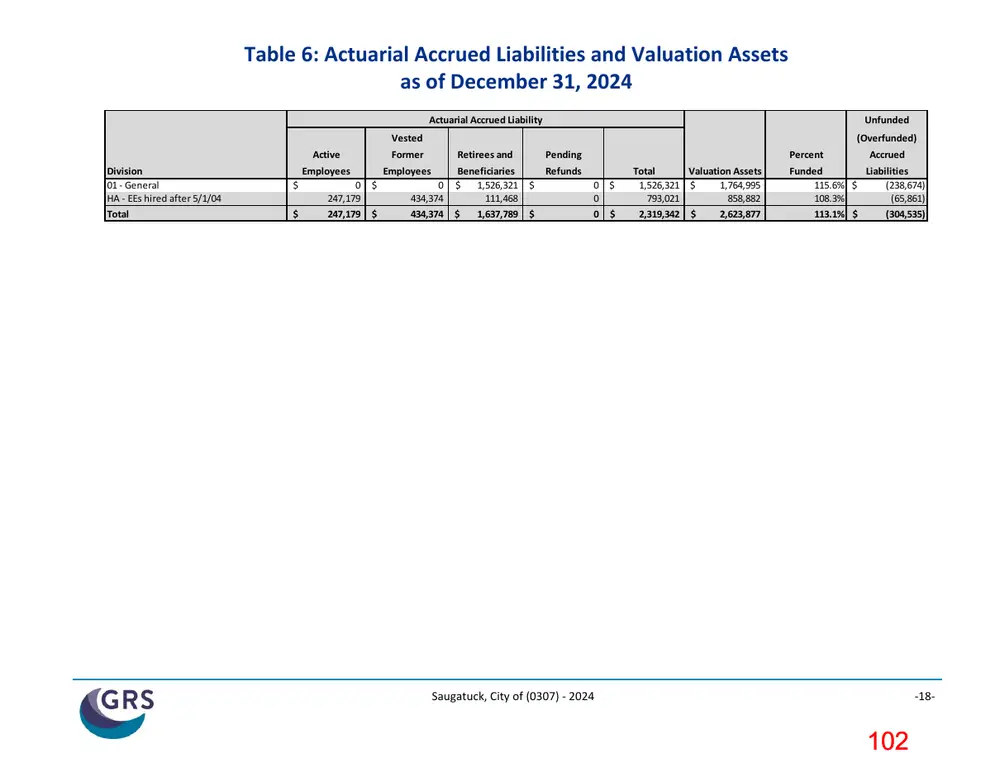
Table 6: Actuarial Accrued Liabilities and Valuation Assets as of December 31, 2024 Actuarial Accrued Liability
Unfunded
Vested Division 01 - General HA - EEs hired after 5/1/04 Total
(Overfunded)
Active
Former
Retirees and
Pending
Employees
Employees
Beneficiaries $ 1,526,321 111,468 $ 1,637,789
Refunds
0 247,179 247,179
0 434,374 434,374
Percent 0 $ 0 0 $
Total Valuation Assets 1,526,321 $ 1,764,995 793,021 858,882 2,319,342 $ 2,623,877
Accrued
Funded Liabilities 115.6% $ (238,674) 108.3% (65,861) 113.1% $ (304,535)
Saugatuck, City of (0307) - 2024
-18-
Page 103
Text of page 103
The following results show the combined accrued liabilities and assets for each set of linked divisions. These results are already shown in the table on the prior page(s).
Table 6 (continued)
Division Linked Divisions HA, 01
Active Employees $ 247,179
Actuarial Accrued Liability Vested Former Retirees and Pending Employees Beneficiaries Refunds $ 434,374 $ 1,637,789 $
Total Valuation Assets 2,319,342 $ 2,623,877
Unfunded (Overfunded) Percent Accrued Funded Liabilities 113.1% $ (304,535)
Please see the Comments on Asset Smoothing in the Executive Summary of this report. The December 31, 2024 valuation assets (actuarial value of assets) are equal to 1.065367 times the reported market value of assets. Refer to the Appendix for a description of the valuation asset derivation and a detailed calculation of valuation assets.
Saugatuck, City of (0307) - 2024
-19-
Page 104
This page is a scanned image with no text layer. The PDF of these pages has it at full resolution.
Page 105
Text of page 105
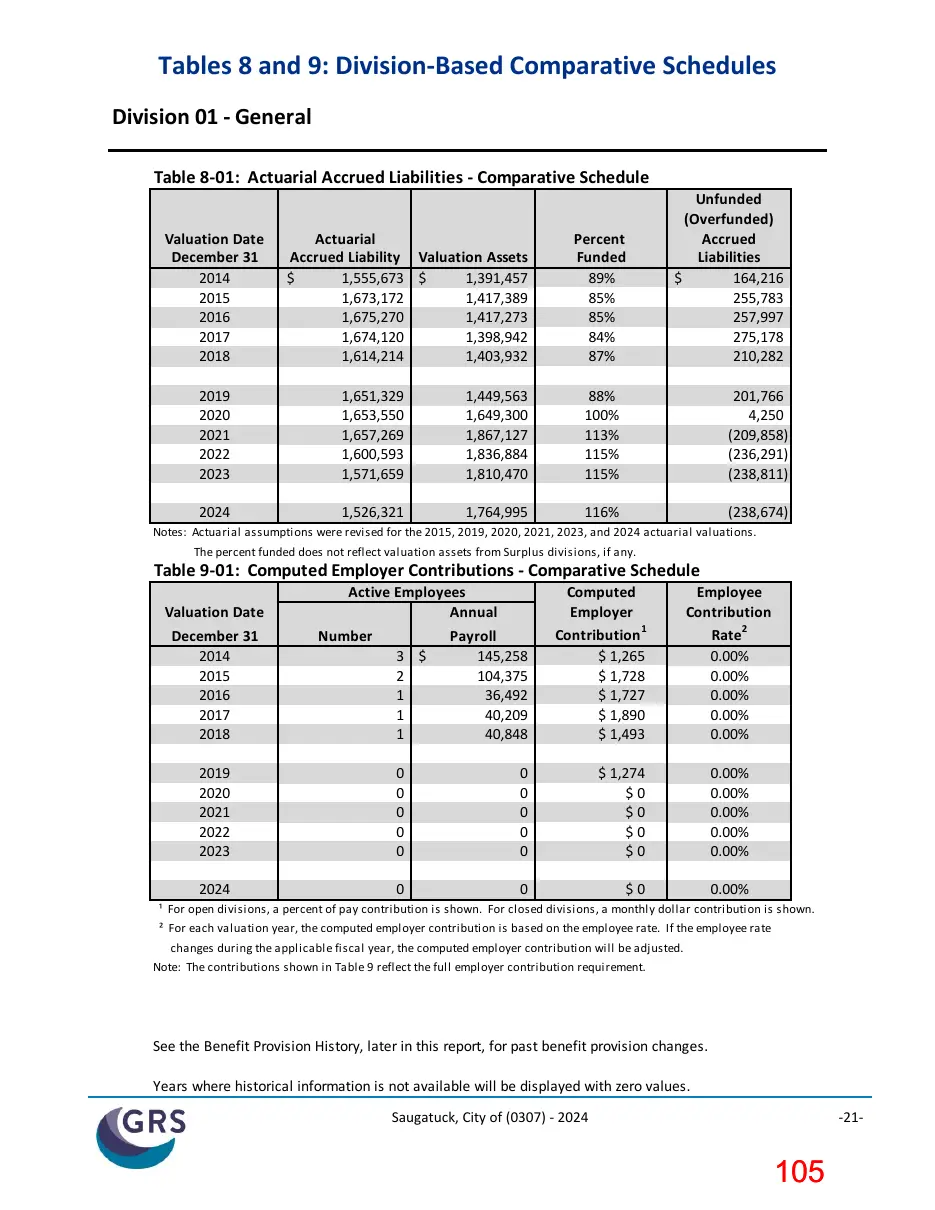
Tables 8 and 9: Division-Based Comparative Schedules Division 01 - General Table 8-01: Actuarial Accrued Liabilities - Comparative Schedule Valuation Date December 31 2014 2015 2016 2017 2018
Actuarial Accrued Liability Valuation Assets $ 1,555,673 $ 1,391,457 1,673,172 1,417,389 1,675,270 1,417,273 1,674,120 1,398,942 1,614,214 1,403,932
Percent Funded 89% 85% 85% 84% 87%
Unfunded (Overfunded) Accrued Liabilities $ 164,216 255,783 257,997 275,178 210,282
2019 2020 2021 2022 2023
1,651,329 1,653,550 1,657,269 1,600,593 1,571,659
1,449,563 1,649,300 1,867,127 1,836,884 1,810,470
88% 100% 113% 115% 115%
201,766 4,250 (209,858) (236,291) (238,811)
2024
1,526,321
1,764,995
116%
(238,674)
Notes: Actuarial assumptions were revised for the 2015, 2019, 2020, 2021, 2023, and 2024 actuarial valuations. The percent funded does not reflect valuation assets from Surplus divisions, if any.
Table 9-01: Computed Employer Contributions - Comparative Schedule Valuation Date December 31 2014 2015 2016 2017 2018
Active Employees Annual Number Payroll 3 $ 145,258 2 104,375 1 36,492 1 40,209 1 40,848
Computed Employer Contribution 1 $ 1,265 $ 1,728 $ 1,727 $ 1,890 $ 1,493
Employee Contribution Rate2 0.00% 0.00% 0.00% 0.00% 0.00%
2019 2020 2021 2022 2023
0 0 0 0 0
0 0 0 0 0
$ 1,274 $0 $0 $0 $0
0.00% 0.00% 0.00% 0.00% 0.00%
2024
0.00%
¹ For open divisions, a percent of pay contribution is shown. For closed divisions, a monthly dollar contribution is shown. ² For each valuation year, the computed employer contribution is based on the employee rate. If the employee rate changes during the applicable fiscal year, the computed employer contribution will be adjusted. Note: The contributions shown in Table 9 reflect the full employer contribution requirement.
See the Benefit Provision History, later in this report, for past benefit provision changes. Years where historical information is not available will be displayed with zero values. Saugatuck, City of (0307) - 2024
-21-
Page 106
Text of page 106
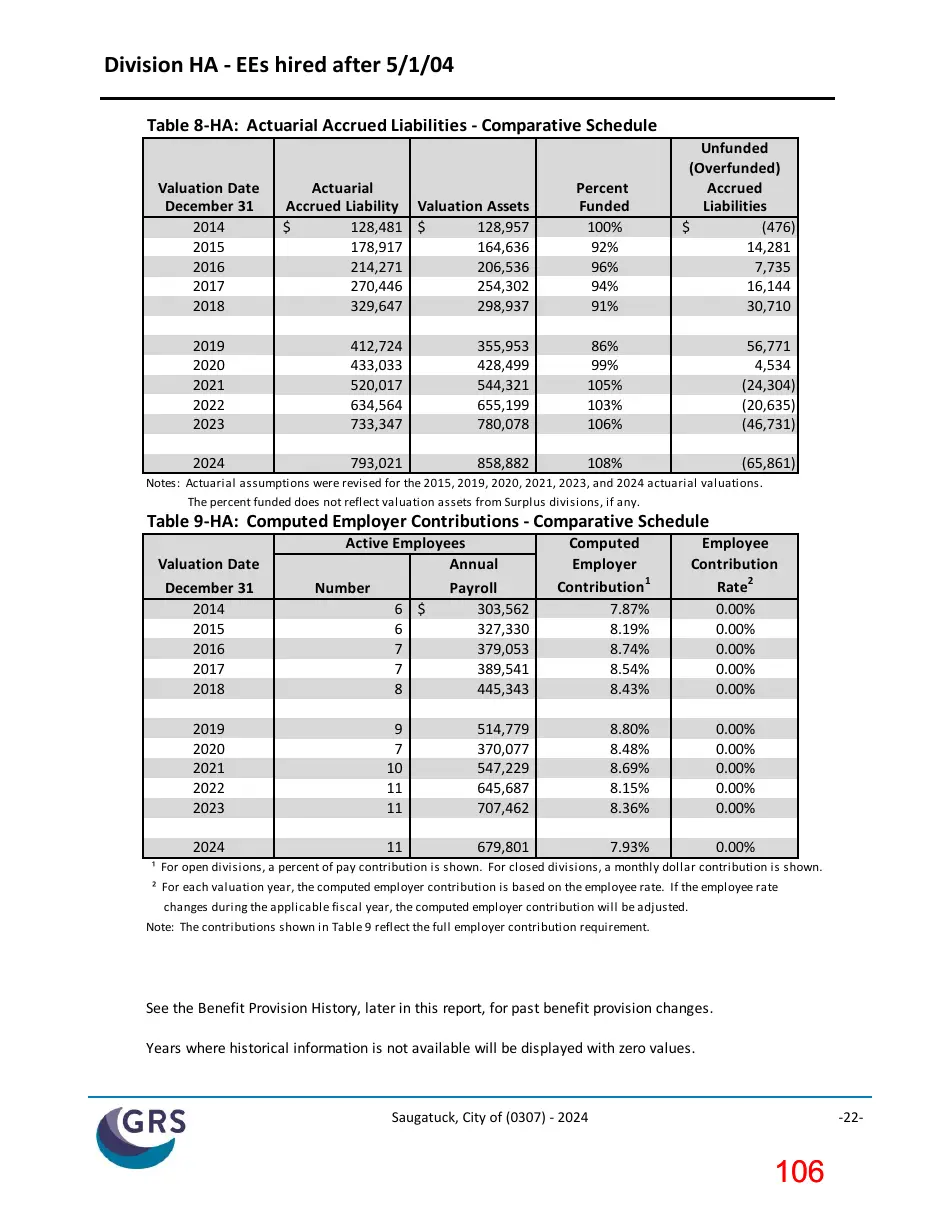
Division HA - EEs hired after 5/1/04 Table 8-HA: Actuarial Accrued Liabilities - Comparative Schedule Valuation Date December 31 2014 2015 2016 2017 2018
Actuarial Accrued Liability Valuation Assets $ 128,481 $ 128,957 178,917 164,636 214,271 206,536 270,446 254,302 329,647 298,937
Percent Funded 100% 92% 96% 94% 91%
Unfunded (Overfunded) Accrued Liabilities $ (476) 14,281 7,735 16,144 30,710
2019 2020 2021 2022 2023
412,724 433,033 520,017 634,564 733,347
355,953 428,499 544,321 655,199 780,078
86% 99% 105% 103% 106%
56,771 4,534 (24,304) (20,635) (46,731)
2024
793,021
858,882
108%
(65,861)
Notes: Actuarial assumptions were revised for the 2015, 2019, 2020, 2021, 2023, and 2024 actuarial valuations. The percent funded does not reflect valuation assets from Surplus divisions, if any.
Table 9-HA: Computed Employer Contributions - Comparative Schedule Valuation Date December 31 2014 2015 2016 2017 2018
Active Employees Annual Number Payroll 6 $ 303,562 6 327,330 7 379,053 7 389,541 8 445,343
Computed Employer Contribution 1 7.87% 8.19% 8.74% 8.54% 8.43%
Employee Contribution Rate2 0.00% 0.00% 0.00% 0.00% 0.00%
2019 2020 2021 2022 2023
9 7 10 11 11
514,779 370,077 547,229 645,687 707,462
8.80% 8.48% 8.69% 8.15% 8.36%
0.00% 0.00% 0.00% 0.00% 0.00%
2024
679,801
7.93%
0.00%
¹ For open divisions, a percent of pay contribution is shown. For closed divisions, a monthly dollar contribution is shown. ² For each valuation year, the computed employer contribution is based on the employee rate. If the employee rate changes during the applicable fiscal year, the computed employer contribution will be adjusted. Note: The contributions shown in Table 9 reflect the full employer contribution requirement.
See the Benefit Provision History, later in this report, for past benefit provision changes. Years where historical information is not available will be displayed with zero values.
Saugatuck, City of (0307) - 2024
-22-
Page 107
Text of page 107
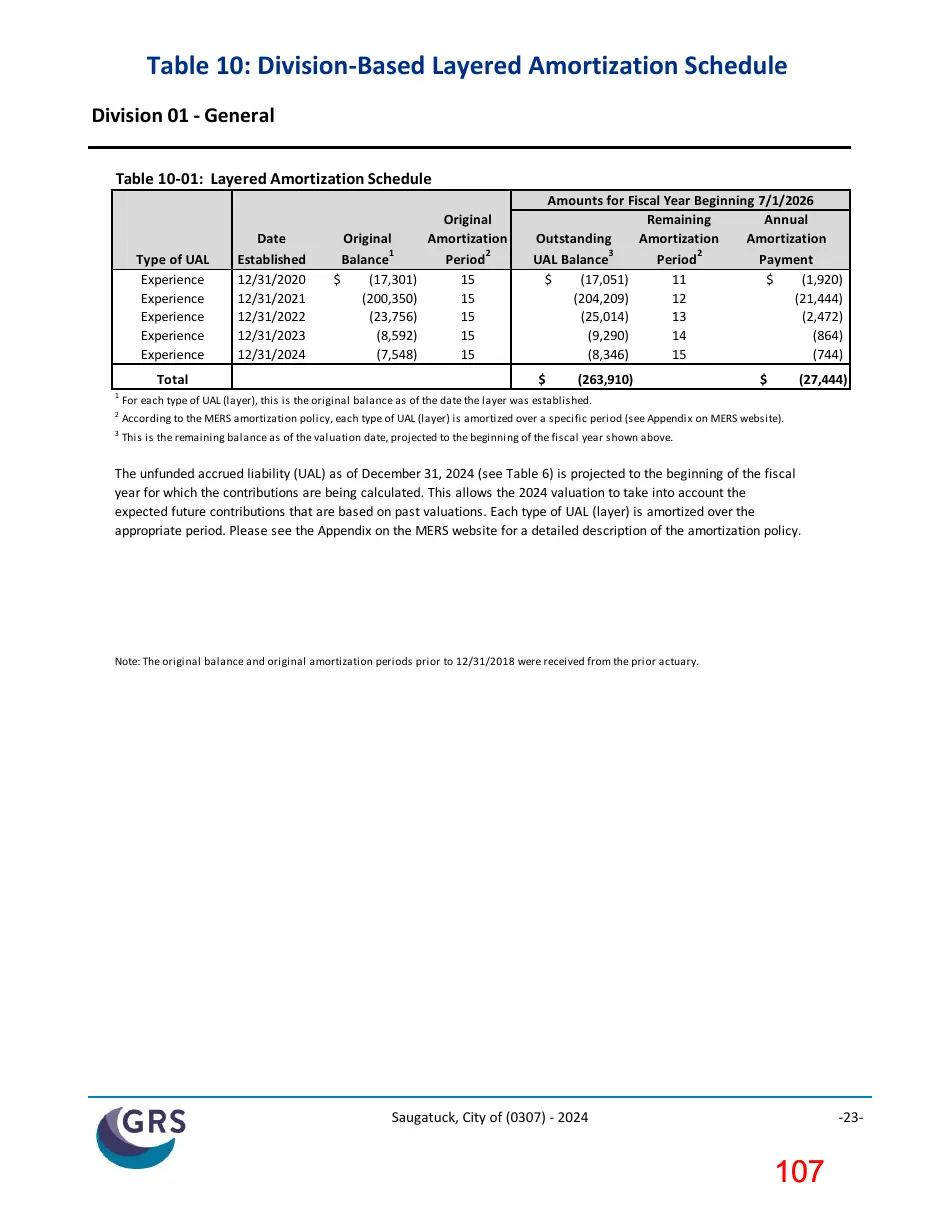
Table 10: Division-Based Layered Amortization Schedule Division 01 - General Table 10-01: Layered Amortization Schedule
Type of UAL Experience Experience Experience Experience Experience Total
Date Established 12/31/2020 12/31/2021 12/31/2022 12/31/2023 12/31/2024
Original Balance1 $ (17,301) (200,350) (23,756) (8,592) (7,548)
Original Amortization Period 2 15 15 15 15 15
Amounts for Fiscal Year Beginning 7/1/2026 Remaining Annual Outstanding Amortization Amortization UAL Balance3 Period 2 Payment $ (17,051) 11 $ (1,920) (204,209) 12 (21,444) (25,014) 13 (2,472) (9,290) 14 (864) (8,346) 15 (744) $
(263,910)
(27,444)
For each type of UAL (layer), this is the original balance as of the date the layer was established.
According to the MERS amortization policy, each type of UAL (layer) is amortized over a specific period (see Appendix on MERS website).
This is the remaining balance as of the valuation date, projected to the beginning of the fiscal year shown above.
The unfunded accrued liability (UAL) as of December 31, 2024 (see Table 6) is projected to the beginning of the fiscal year for which the contributions are being calculated. This allows the 2024 valuation to take into account the expected future contributions that are based on past valuations. Each type of UAL (layer) is amortized over the appropriate period. Please see the Appendix on the MERS website for a detailed description of the amortization policy.
Note: The original balance and original amortization periods prior to 12/31/2018 were received from the prior actuary.
Saugatuck, City of (0307) - 2024
-23-
Page 108
Text of page 108
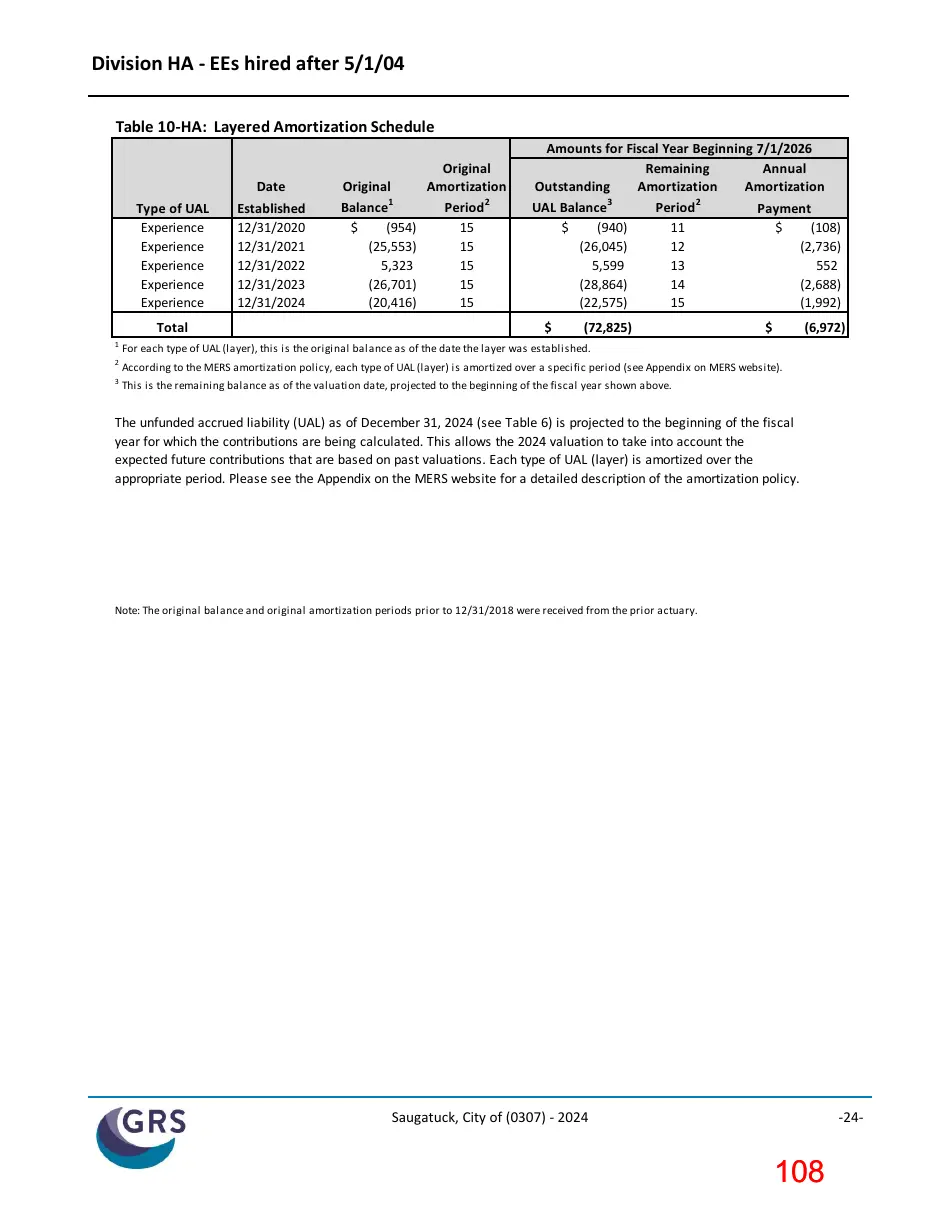
Division HA - EEs hired after 5/1/04 Table 10-HA: Layered Amortization Schedule
Type of UAL Experience Experience Experience Experience Experience Total
Date Established 12/31/2020 12/31/2021 12/31/2022 12/31/2023 12/31/2024
Original Balance1 $ (954) (25,553) 5,323 (26,701) (20,416)
Original Amortization Period 2 15 15 15 15 15
Amounts for Fiscal Year Beginning 7/1/2026 Remaining Annual Outstanding Amortization Amortization UAL Balance3 Period 2 Payment $ (940) 11 $ (108) (26,045) 12 (2,736) 5,599 13 552 (28,864) 14 (2,688) (22,575) 15 (1,992) $
(72,825)
(6,972)
For each type of UAL (layer), this is the original balance as of the date the layer was established.
According to the MERS amortization policy, each type of UAL (layer) is amortized over a specific period (see Appendix on MERS website).
This is the remaining balance as of the valuation date, projected to the beginning of the fiscal year shown above.
The unfunded accrued liability (UAL) as of December 31, 2024 (see Table 6) is projected to the beginning of the fiscal year for which the contributions are being calculated. This allows the 2024 valuation to take into account the expected future contributions that are based on past valuations. Each type of UAL (layer) is amortized over the appropriate period. Please see the Appendix on the MERS website for a detailed description of the amortization policy.
Note: The original balance and original amortization periods prior to 12/31/2018 were received from the prior actuary.
Saugatuck, City of (0307) - 2024
-24-
Page 109
Text of page 109
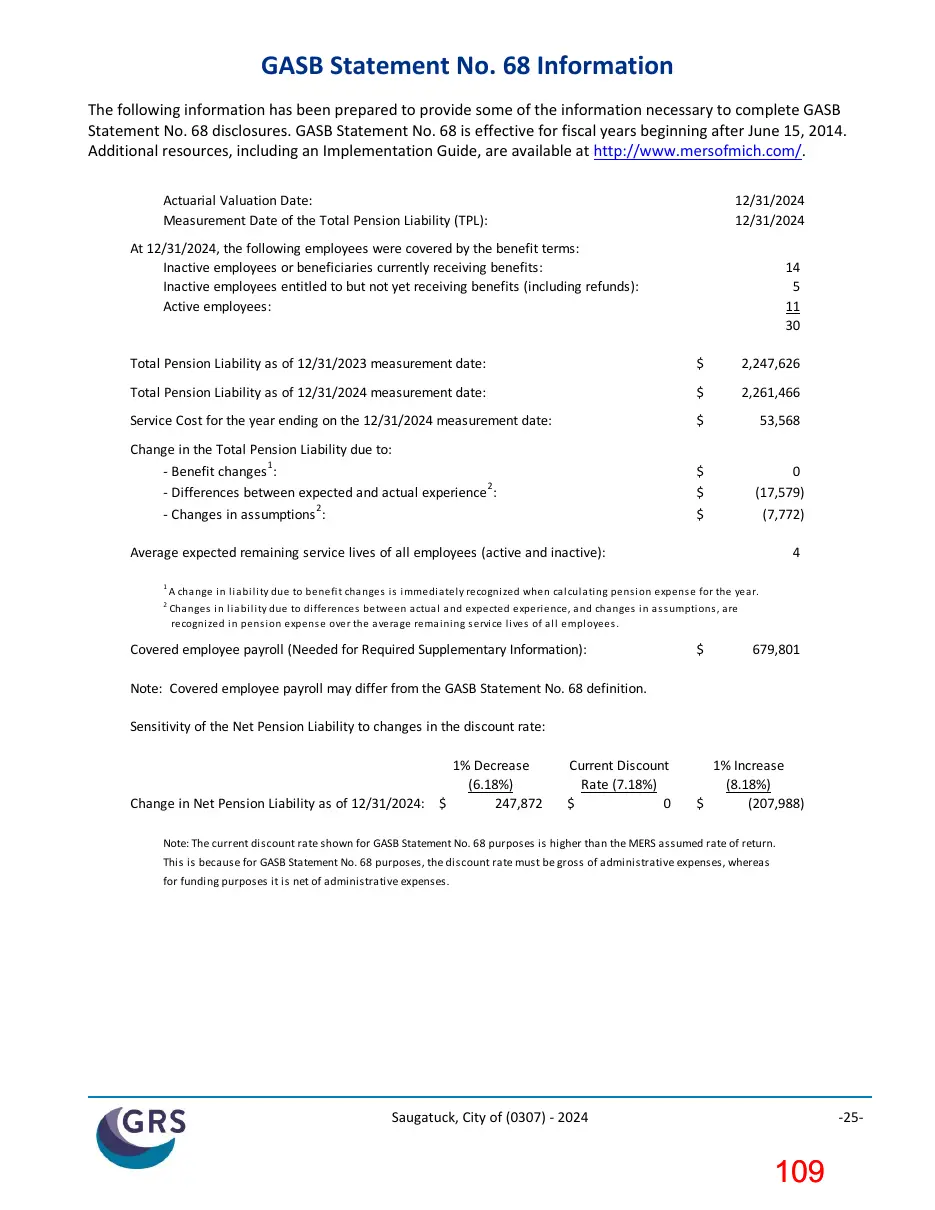
GASB Statement No. 68 Information The following information has been prepared to provide some of the information necessary to complete GASB Statement No. 68 disclosures. GASB Statement No. 68 is effective for fiscal years beginning after June 15, 2014. Additional resources, including an Implementation Guide, are available at http://www.mersofmich.com/. Actuarial Valuation Date: Measurement Date of the Total Pension Liability (TPL):
12/31/2024 12/31/2024
At 12/31/2024, the following employees were covered by the benefit terms: Inactive employees or beneficiaries currently receiving benefits: Inactive employees entitled to but not yet receiving benefits (including refunds): Active employees:
14 5 11 30
Total Pension Liability as of 12/31/2023 measurement date:
2,247,626
Total Pension Liability as of 12/31/2024 measurement date:
2,261,466
Service Cost for the year ending on the 12/31/2024 measurement date:
53,568
Change in the Total Pension Liability due to: 1 - Benefit changes : 2 - Differences between expected and actual experience : 2 - Changes in assumptions :
0 (17,579) (7,772)
Average expected remaining service lives of all employees (active and inactive):
A cha nge i n l i a bi l i ty due to benefi t cha nges i s i mmedi a tel y recogni zed when ca l cul a ti ng pens i on expens e for the yea r.
Cha nges i n l i a bi l i ty due to di fferences between a ctua l a nd expected experi ence, a nd cha nges i n a s s umpti ons , a re recogni zed i n pens i on expens e over the a vera ge rema i ni ng s ervi ce l i ves of a l l empl oyees .
Covered employee payroll (Needed for Required Supplementary Information):
679,801
Note: Covered employee payroll may differ from the GASB Statement No. 68 definition. Sensitivity of the Net Pension Liability to changes in the discount rate: 1% Decrease (6.18%) Change in Net Pension Liability as of 12/31/2024: $ 247,872
Current Discount Rate (7.18%) $ 0
1% Increase (8.18%) $ (207,988)
Note: The current discount rate shown for GASB Statement No. 68 purposes is higher than the MERS assumed rate of return. This is because for GASB Statement No. 68 purposes, the discount rate must be gross of administrative expenses, whereas for funding purposes it is net of administrative expenses.
Saugatuck, City of (0307) - 2024
-25-
Page 110
Text of page 110
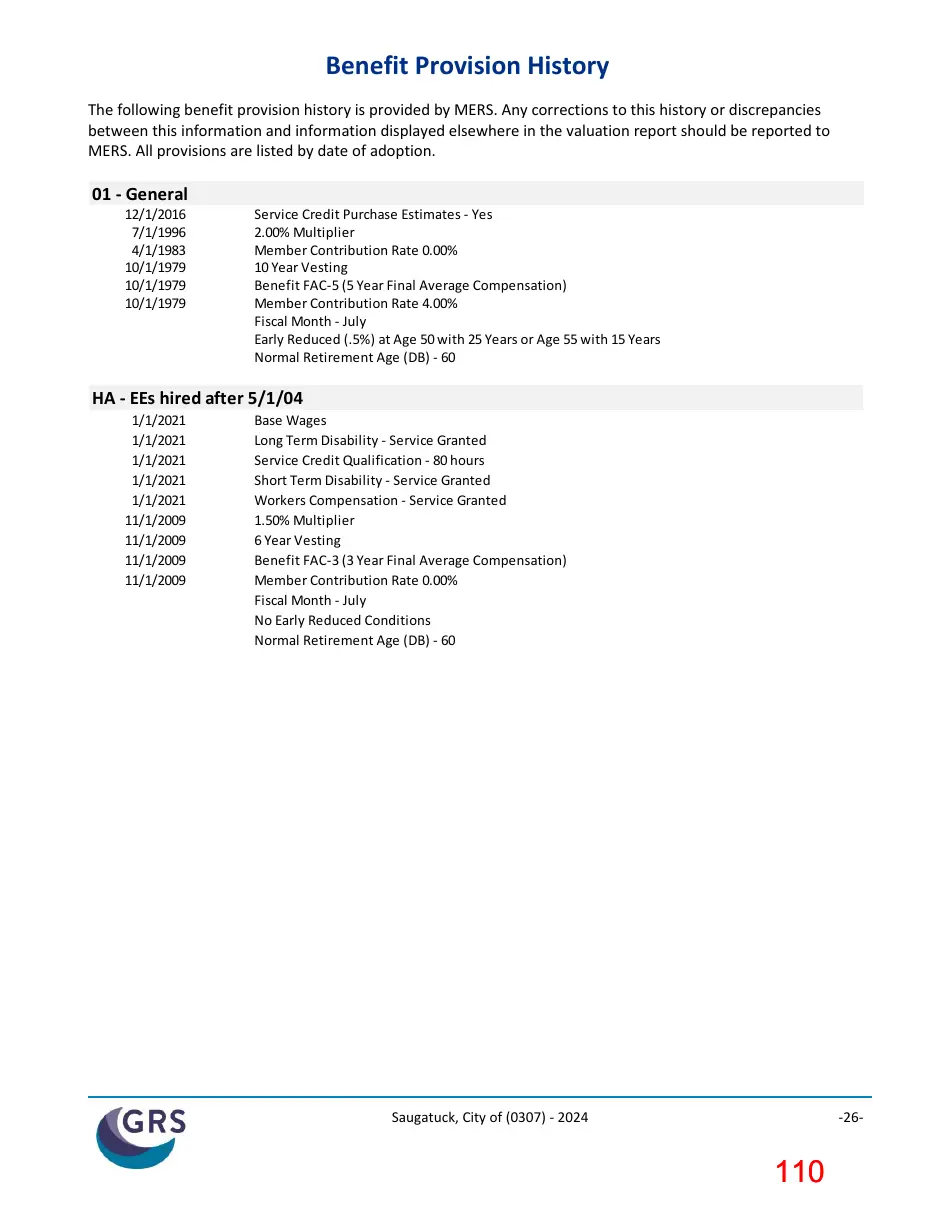
Benefit Provision History The following benefit provision history is provided by MERS. Any corrections to this history or discrepancies between this information and information displayed elsewhere in the valuation report should be reported to MERS. All provisions are listed by date of adoption.
01 - General 12/1/2016 7/1/1996 4/1/1983 10/1/1979 10/1/1979 10/1/1979
Service Credit Purchase Estimates - Yes 2.00% Multiplier Member Contribution Rate 0.00% 10 Year Vesting Benefit FAC-5 (5 Year Final Average Compensation) Member Contribution Rate 4.00% Fiscal Month - July Early Reduced (.5%) at Age 50 with 25 Years or Age 55 with 15 Years Normal Retirement Age (DB) - 60
HA - EEs hired after 5/1/04 1/1/2021 1/1/2021 1/1/2021 1/1/2021 1/1/2021 11/1/2009 11/1/2009 11/1/2009 11/1/2009
Base Wages Long Term Disability - Service Granted Service Credit Qualification - 80 hours Short Term Disability - Service Granted Workers Compensation - Service Granted 1.50% Multiplier 6 Year Vesting Benefit FAC-3 (3 Year Final Average Compensation) Member Contribution Rate 0.00% Fiscal Month - July No Early Reduced Conditions Normal Retirement Age (DB) - 60
Saugatuck, City of (0307) - 2024
-26-
Page 111
Text of page 111
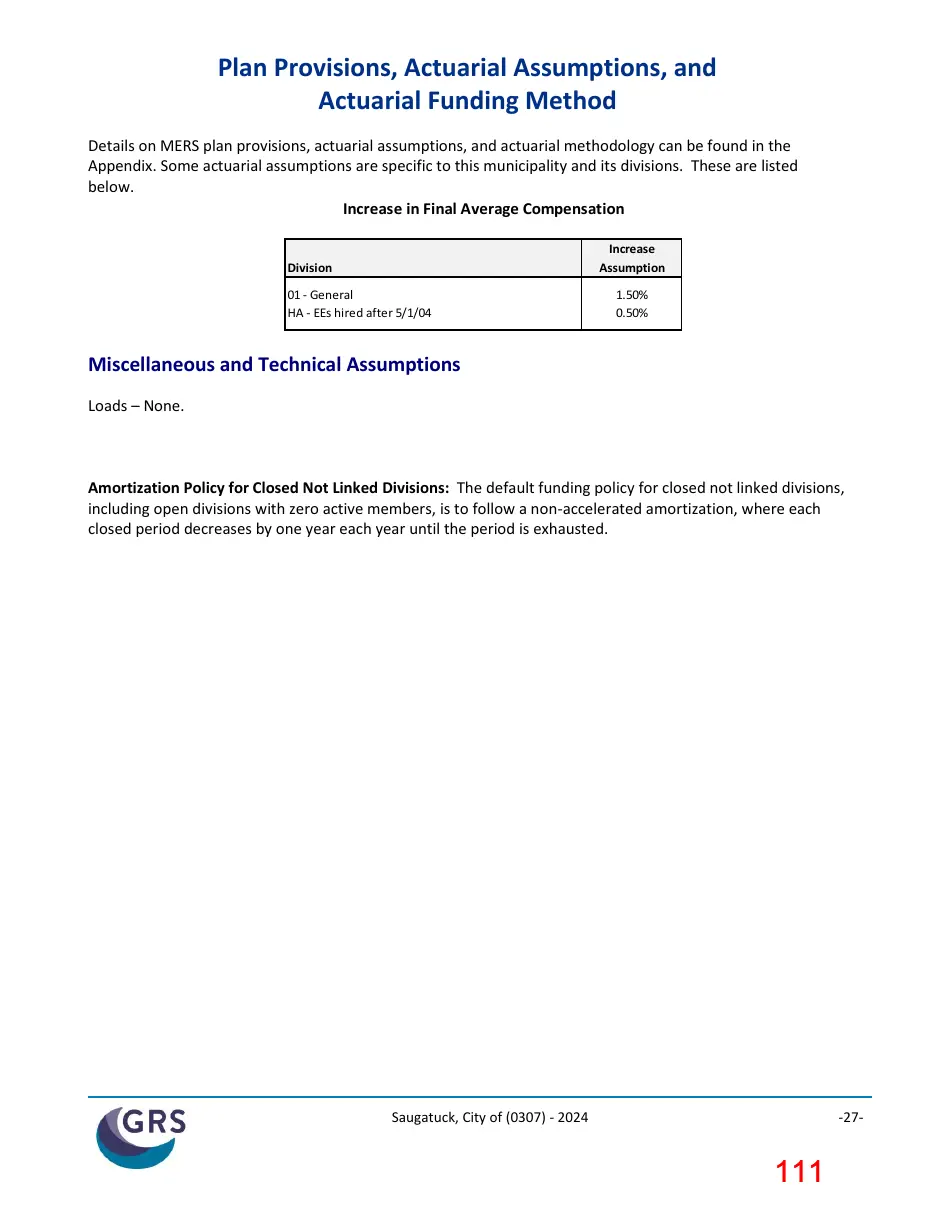
Plan Provisions, Actuarial Assumptions, and Actuarial Funding Method Details on MERS plan provisions, actuarial assumptions, and actuarial methodology can be found in the Appendix. Some actuarial assumptions are specific to this municipality and its divisions. These are listed below. Increase in Final Average Compensation Increase Assumption
Division 01 - General HA - EEs hired after 5/1/04
1.50% 0.50%
Miscellaneous and Technical Assumptions Loads – None.
Amortization Policy for Closed Not Linked Divisions: The default funding policy for closed not linked divisions, including open divisions with zero active members, is to follow a non-accelerated amortization, where each closed period decreases by one year each year until the period is exhausted.
Saugatuck, City of (0307) - 2024
-27-
Page 112
Text of page 112
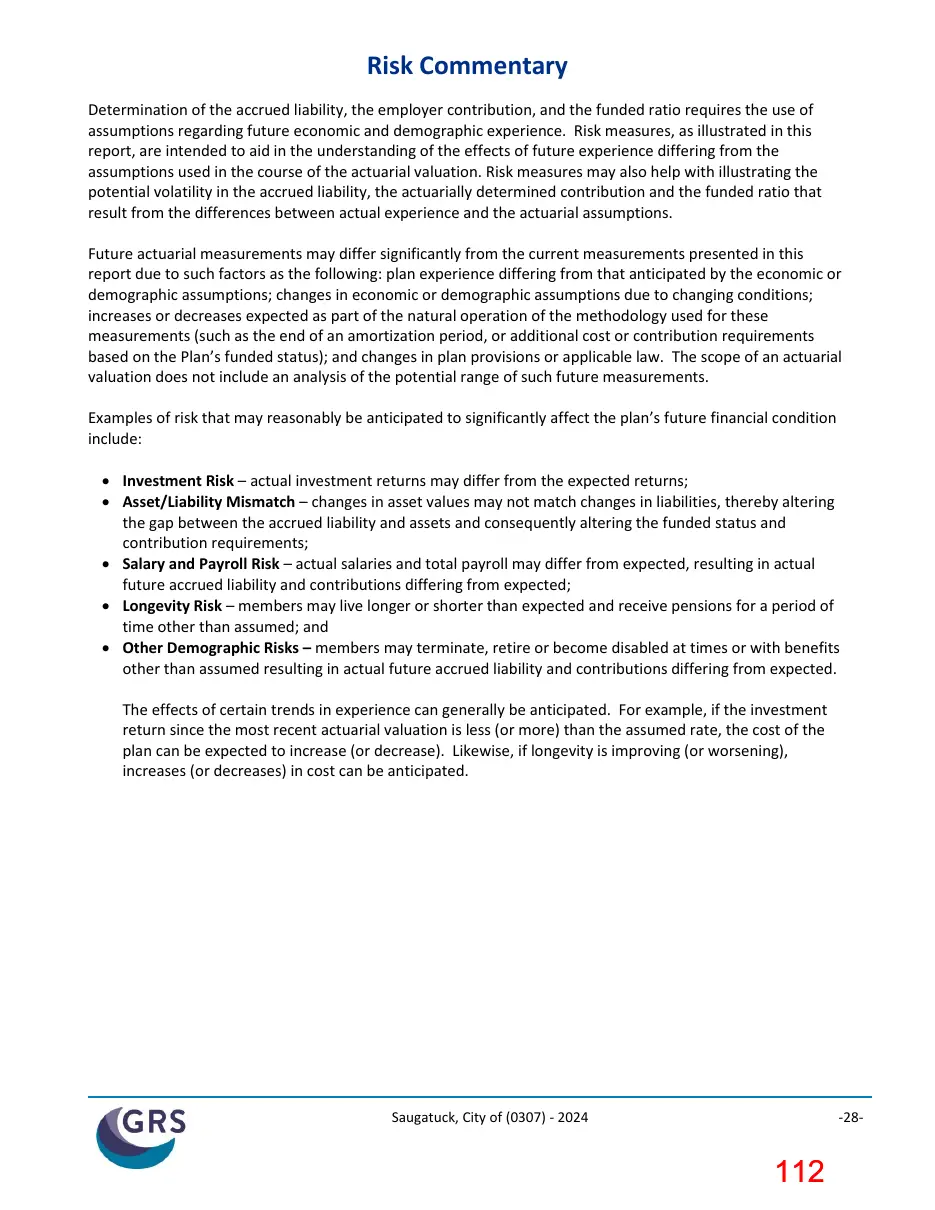
Risk Commentary Determination of the accrued liability, the employer contribution, and the funded ratio requires the use of assumptions regarding future economic and demographic experience. Risk measures, as illustrated in this report, are intended to aid in the understanding of the effects of future experience differing from the assumptions used in the course of the actuarial valuation. Risk measures may also help with illustrating the potential volatility in the accrued liability, the actuarially determined contribution and the funded ratio that result from the differences between actual experience and the actuarial assumptions. Future actuarial measurements may differ significantly from the current measurements presented in this report due to such factors as the following: plan experience differing from that anticipated by the economic or demographic assumptions; changes in economic or demographic assumptions due to changing conditions; increases or decreases expected as part of the natural operation of the methodology used for these measurements (such as the end of an amortization period, or additional cost or contribution requirements based on the Plan’s funded status); and changes in plan provisions or applicable law. The scope of an actuarial valuation does not include an analysis of the potential range of such future measurements. Examples of risk that may reasonably be anticipated to significantly affect the plan’s future financial condition include: • Investment Risk – actual investment returns may differ from the expected returns; • Asset/Liability Mismatch – changes in asset values may not match changes in liabilities, thereby altering the gap between the accrued liability and assets and consequently altering the funded status and contribution requirements; • Salary and Payroll Risk – actual salaries and total payroll may differ from expected, resulting in actual future accrued liability and contributions differing from expected; • Longevity Risk – members may live longer or shorter than expected and receive pensions for a period of time other than assumed; and • Other Demographic Risks – members may terminate, retire or become disabled at times or with benefits other than assumed resulting in actual future accrued liability and contributions differing from expected. The effects of certain trends in experience can generally be anticipated. For example, if the investment return since the most recent actuarial valuation is less (or more) than the assumed rate, the cost of the plan can be expected to increase (or decrease). Likewise, if longevity is improving (or worsening), increases (or decreases) in cost can be anticipated.
Saugatuck, City of (0307) - 2024
-28-
Page 113
Text of page 113
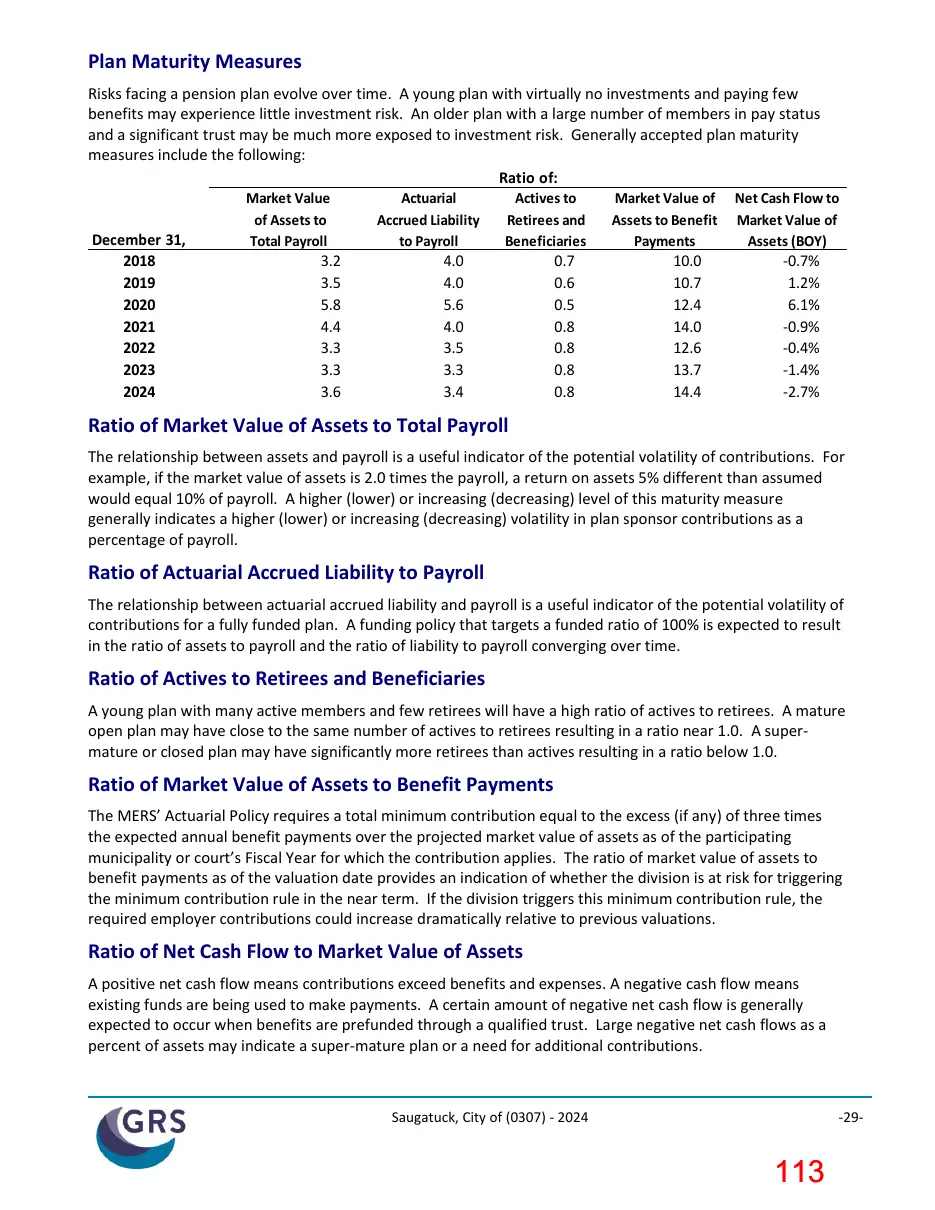
Plan Maturity Measures Risks facing a pension plan evolve over time. A young plan with virtually no investments and paying few benefits may experience little investment risk. An older plan with a large number of members in pay status and a significant trust may be much more exposed to investment risk. Generally accepted plan maturity measures include the following: Ratio of:
December 31, 2018 2019 2020 2021 2022 2023 2024
Market Value of Assets to Total Payroll
3.2 3.5 5.8 4.4 3.3 3.3 3.6
Actuarial Accrued Liability to Payroll
Actives to Retirees and Beneficiaries
4.0 4.0 5.6 4.0 3.5 3.3 3.4
0.7 0.6 0.5 0.8 0.8 0.8 0.8
Market Value of Assets to Benefit Payments
10.0 10.7 12.4 14.0 12.6 13.7 14.4
Net Cash Flow to Market Value of Assets (BOY)
-0.7% 1.2% 6.1% -0.9% -0.4% -1.4% -2.7%
Ratio of Market Value of Assets to Total Payroll The relationship between assets and payroll is a useful indicator of the potential volatility of contributions. For example, if the market value of assets is 2.0 times the payroll, a return on assets 5% different than assumed would equal 10% of payroll. A higher (lower) or increasing (decreasing) level of this maturity measure generally indicates a higher (lower) or increasing (decreasing) volatility in plan sponsor contributions as a percentage of payroll.
Ratio of Actuarial Accrued Liability to Payroll The relationship between actuarial accrued liability and payroll is a useful indicator of the potential volatility of contributions for a fully funded plan. A funding policy that targets a funded ratio of 100% is expected to result in the ratio of assets to payroll and the ratio of liability to payroll converging over time.
Ratio of Actives to Retirees and Beneficiaries A young plan with many active members and few retirees will have a high ratio of actives to retirees. A mature open plan may have close to the same number of actives to retirees resulting in a ratio near 1.0. A supermature or closed plan may have significantly more retirees than actives resulting in a ratio below 1.0.
Ratio of Market Value of Assets to Benefit Payments The MERS’ Actuarial Policy requires a total minimum contribution equal to the excess (if any) of three times the expected annual benefit payments over the projected market value of assets as of the participating municipality or court’s Fiscal Year for which the contribution applies. The ratio of market value of assets to benefit payments as of the valuation date provides an indication of whether the division is at risk for triggering the minimum contribution rule in the near term. If the division triggers this minimum contribution rule, the required employer contributions could increase dramatically relative to previous valuations.
Ratio of Net Cash Flow to Market Value of Assets A positive net cash flow means contributions exceed benefits and expenses. A negative cash flow means existing funds are being used to make payments. A certain amount of negative net cash flow is generally expected to occur when benefits are prefunded through a qualified trust. Large negative net cash flows as a percent of assets may indicate a super-mature plan or a need for additional contributions.
Saugatuck, City of (0307) - 2024
-29-
Page 114
Text of page 114
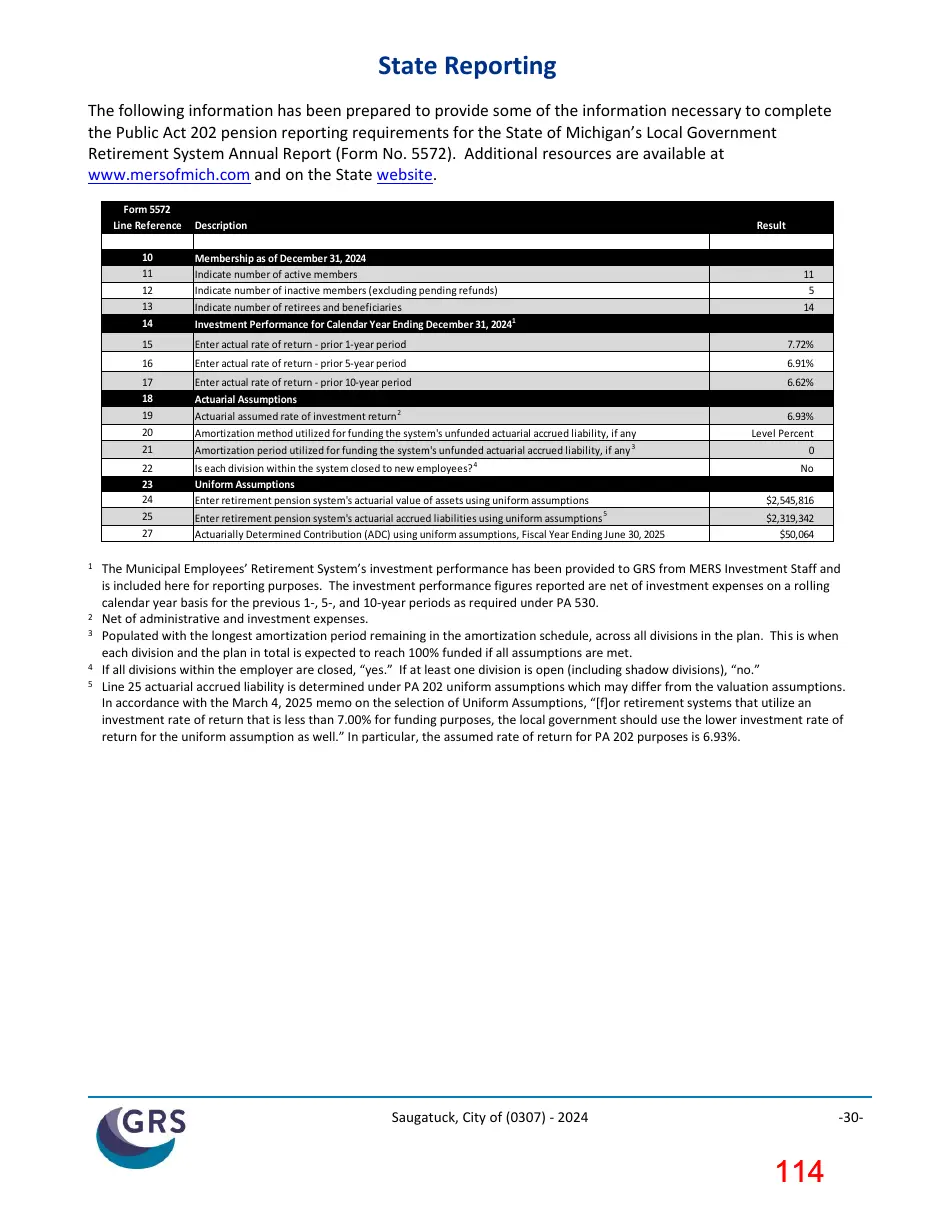
State Reporting The following information has been prepared to provide some of the information necessary to complete the Public Act 202 pension reporting requirements for the State of Michigan’s Local Government Retirement System Annual Report (Form No. 5572). Additional resources are available at www.mersofmich.com and on the State website. Form 5572 Line Reference
Description
Result
10 11 12 13 14
Membership as of December 31, 2024 Indicate number of active members Indicate number of inactive members (excluding pending refunds) Indicate number of retirees and beneficiaries
Enter actual rate of return - prior 1-year period
7.72%
Enter actual rate of return - prior 5-year period
6.91%
17 18 19 20 21
Enter actual rate of return - prior 10-year period Actuarial Assumptions
6.62%
22 23 24 25 27
Is each division within the system closed to new employees? 4 Uniform Assumptions Enter retirement pension system's actuarial value of assets using uniform assumptions
$2,545,816
Enter retirement pension system's actuarial accrued liabilities using uniform assumptions 5 Actuarially Determined Contribution (ADC) using uniform assumptions, Fiscal Year Ending June 30, 2025
$2,319,342 $50,064
11 5 14
Investment Performance for Calendar Year Ending December 31, 20241
Actuarial assumed rate of investment return 2 Amortization method utilized for funding the system's unfunded actuarial accrued liability, if any Amortization period utilized for funding the system's unfunded actuarial accrued liability, if any 3
6.93% Level Percent 0 No
The Municipal Employees’ Retirement System’s investment performance has been provided to GRS from MERS Investment Staff and is included here for reporting purposes. The investment performance figures reported are net of investment expenses on a rolling calendar year basis for the previous 1-, 5-, and 10-year periods as required under PA 530. 2 Net of administrative and investment expenses. 3 Populated with the longest amortization period remaining in the amortization schedule, across all divisions in the plan. This is when each division and the plan in total is expected to reach 100% funded if all assumptions are met. 4 If all divisions within the employer are closed, “yes.” If at least one division is open (including shadow divisions), “no.” 5 Line 25 actuarial accrued liability is determined under PA 202 uniform assumptions which may differ from the valuation assumptions. In accordance with the March 4, 2025 memo on the selection of Uniform Assumptions, “[f]or retirement systems that utilize an investment rate of return that is less than 7.00% for funding purposes, the local government should use the lower investment rate of return for the uniform assumption as well.” In particular, the assumed rate of return for PA 202 purposes is 6.93%.
Saugatuck, City of (0307) - 2024
-30-
Page 115
Text of page 115
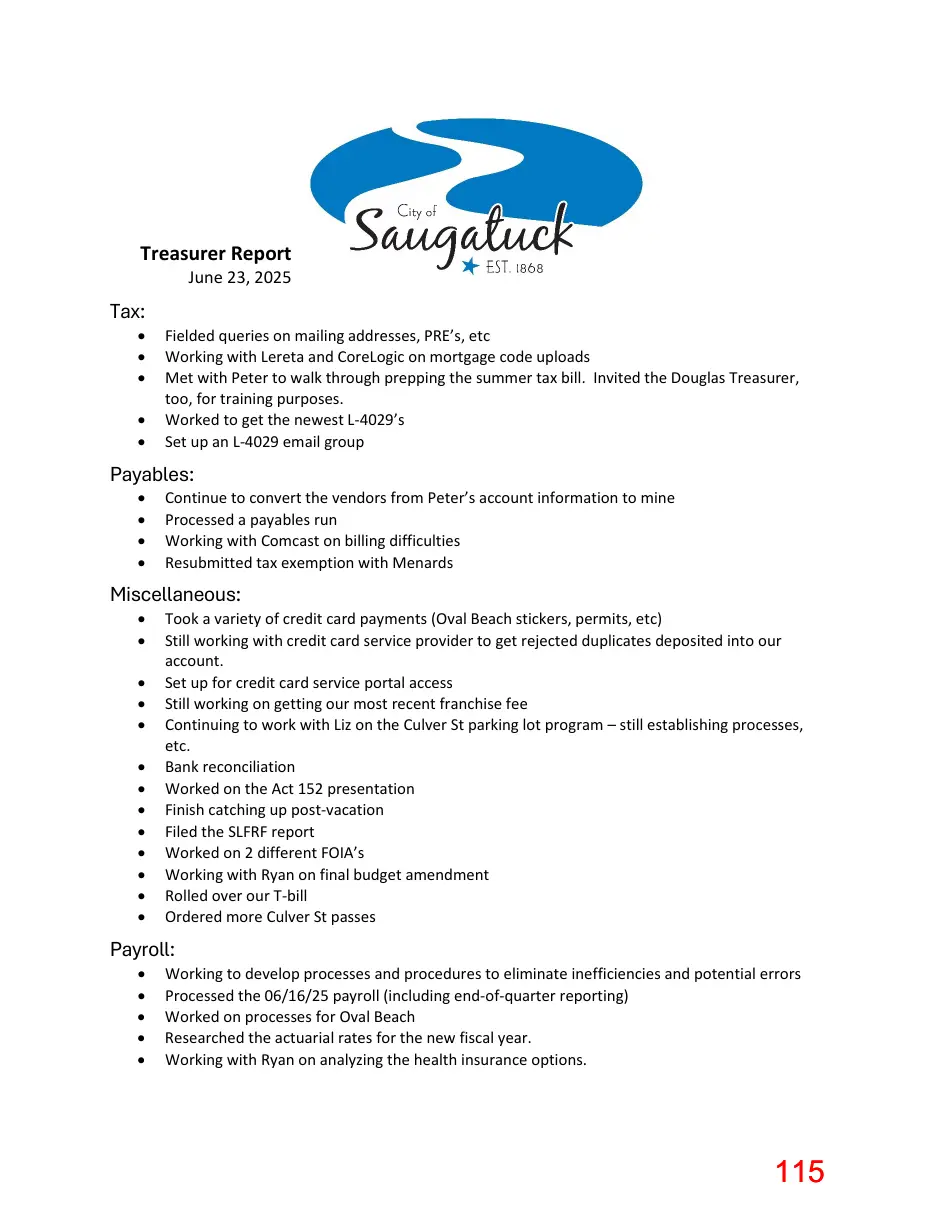
Treasurer Report
June 23, 2025
Tax: • • • • •
Fielded queries on mailing addresses, PRE’s, etc Working with Lereta and CoreLogic on mortgage code uploads Met with Peter to walk through prepping the summer tax bill. Invited the Douglas Treasurer, too, for training purposes. Worked to get the newest L-4029’s Set up an L-4029 email group
Payables: • • • •
Continue to convert the vendors from Peter’s account information to mine Processed a payables run Working with Comcast on billing difficulties Resubmitted tax exemption with Menards
Miscellaneous: • • • • • • • • • • • • •
Took a variety of credit card payments (Oval Beach stickers, permits, etc) Still working with credit card service provider to get rejected duplicates deposited into our account. Set up for credit card service portal access Still working on getting our most recent franchise fee Continuing to work with Liz on the Culver St parking lot program – still establishing processes, etc. Bank reconciliation Worked on the Act 152 presentation Finish catching up post-vacation Filed the SLFRF report Worked on 2 different FOIA’s Working with Ryan on final budget amendment Rolled over our T-bill Ordered more Culver St passes
Payroll: • • • • •
Working to develop processes and procedures to eliminate inefficiencies and potential errors Processed the 06/16/25 payroll (including end-of-quarter reporting) Worked on processes for Oval Beach Researched the actuarial rates for the new fiscal year. Working with Ryan on analyzing the health insurance options.
Page 116
This page is a scanned image with no text layer. The PDF of these pages has it at full resolution.
Page 117
Text of page 117
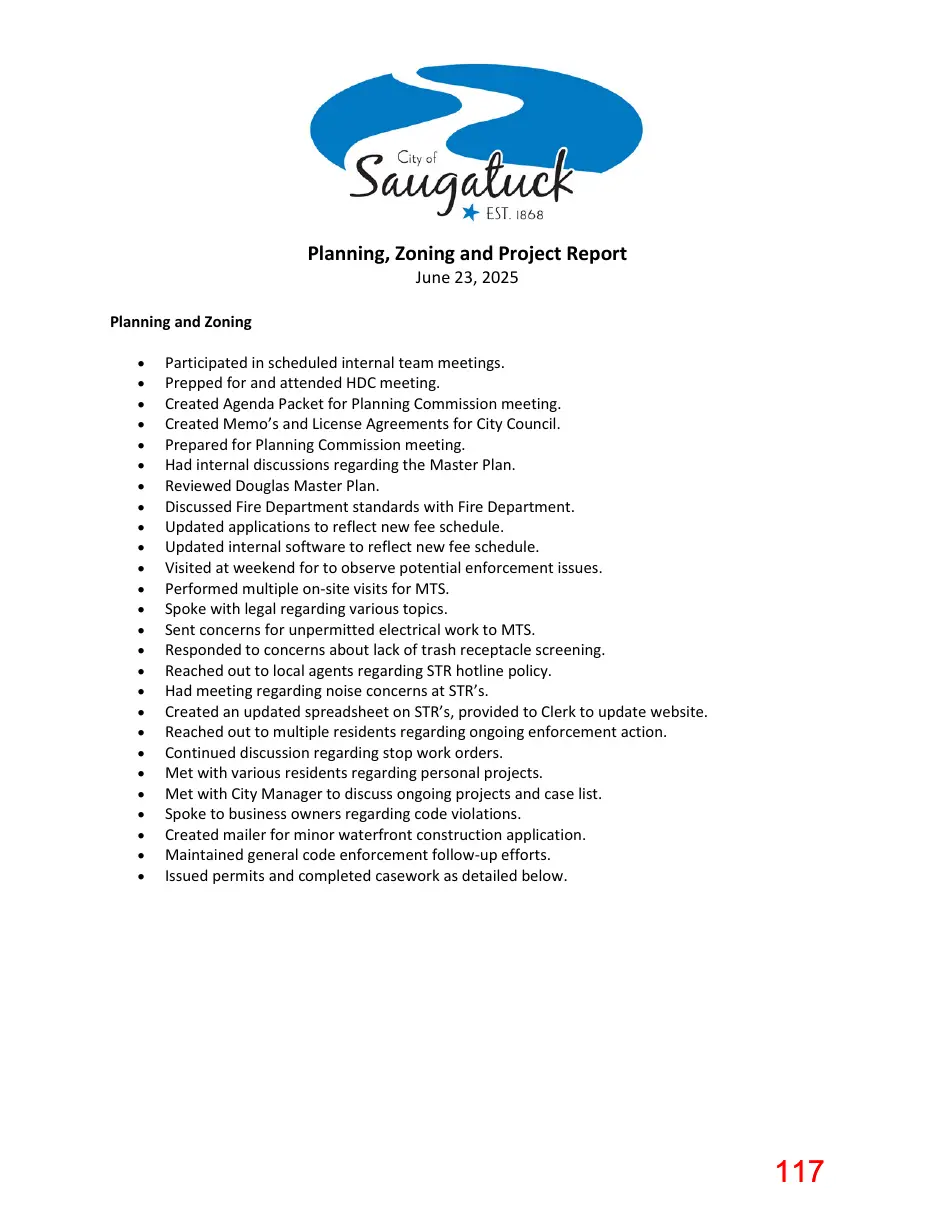
Planning, Zoning and Project Report June 23, 2025
Planning and Zoning • • • • • • • • • • • • • • • • • • • • • • • • • •
Participated in scheduled internal team meetings. Prepped for and attended HDC meeting. Created Agenda Packet for Planning Commission meeting. Created Memo’s and License Agreements for City Council. Prepared for Planning Commission meeting. Had internal discussions regarding the Master Plan. Reviewed Douglas Master Plan. Discussed Fire Department standards with Fire Department. Updated applications to reflect new fee schedule. Updated internal software to reflect new fee schedule. Visited at weekend for to observe potential enforcement issues. Performed multiple on-site visits for MTS. Spoke with legal regarding various topics. Sent concerns for unpermitted electrical work to MTS. Responded to concerns about lack of trash receptacle screening. Reached out to local agents regarding STR hotline policy. Had meeting regarding noise concerns at STR’s. Created an updated spreadsheet on STR’s, provided to Clerk to update website. Reached out to multiple residents regarding ongoing enforcement action. Continued discussion regarding stop work orders. Met with various residents regarding personal projects. Met with City Manager to discuss ongoing projects and case list. Spoke to business owners regarding code violations. Created mailer for minor waterfront construction application. Maintained general code enforcement follow-up efforts. Issued permits and completed casework as detailed below.
Page 118
Text of page 118
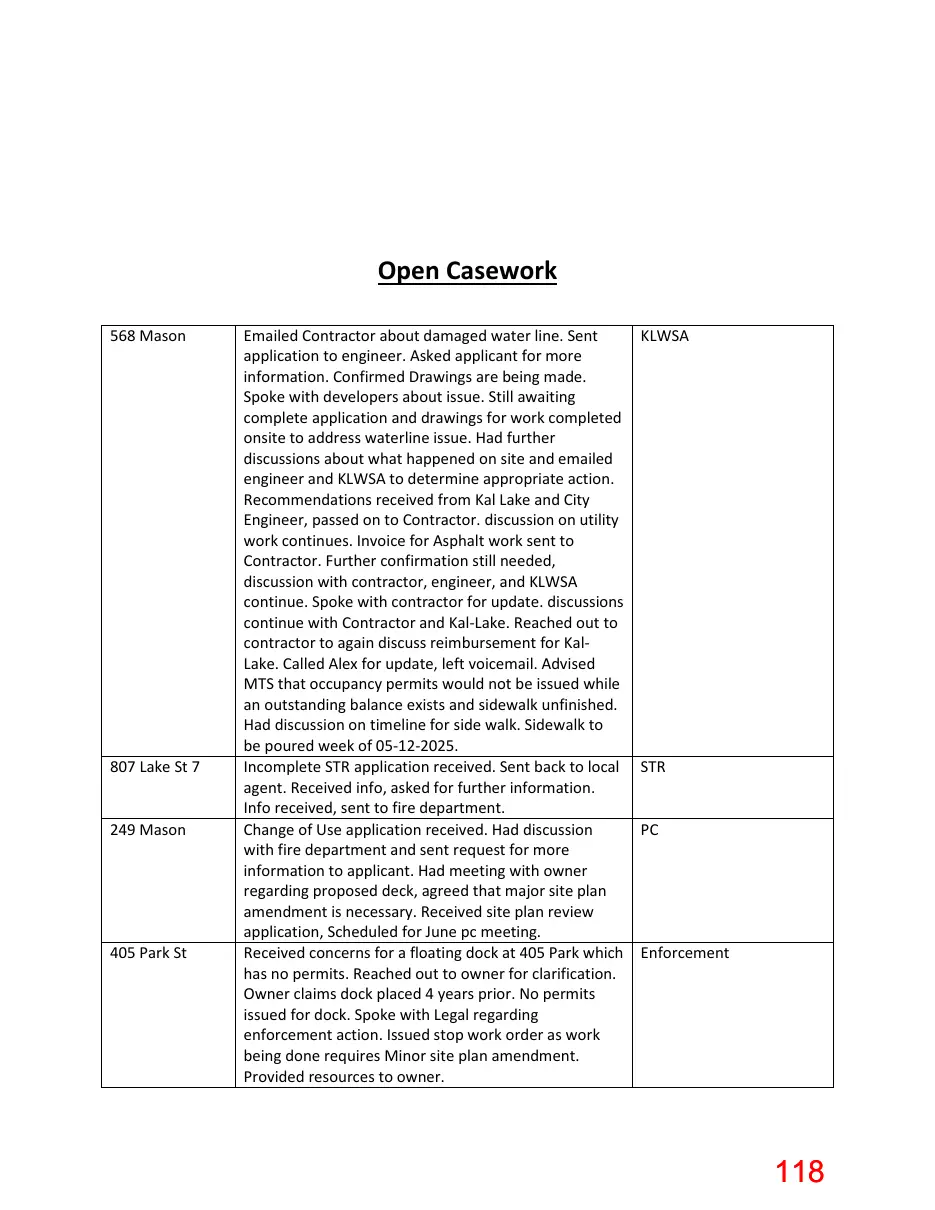
Open Casework 568 Mason
807 Lake St 7 249 Mason
405 Park St
Emailed Contractor about damaged water line. Sent application to engineer. Asked applicant for more information. Confirmed Drawings are being made. Spoke with developers about issue. Still awaiting complete application and drawings for work completed onsite to address waterline issue. Had further discussions about what happened on site and emailed engineer and KLWSA to determine appropriate action. Recommendations received from Kal Lake and City Engineer, passed on to Contractor. discussion on utility work continues. Invoice for Asphalt work sent to Contractor. Further confirmation still needed, discussion with contractor, engineer, and KLWSA continue. Spoke with contractor for update. discussions continue with Contractor and Kal-Lake. Reached out to contractor to again discuss reimbursement for KalLake. Called Alex for update, left voicemail. Advised MTS that occupancy permits would not be issued while an outstanding balance exists and sidewalk unfinished. Had discussion on timeline for side walk. Sidewalk to be poured week of 05-12-2025. Incomplete STR application received. Sent back to local agent. Received info, asked for further information. Info received, sent to fire department. Change of Use application received. Had discussion with fire department and sent request for more information to applicant. Had meeting with owner regarding proposed deck, agreed that major site plan amendment is necessary. Received site plan review application, Scheduled for June pc meeting. Received concerns for a floating dock at 405 Park which has no permits. Reached out to owner for clarification. Owner claims dock placed 4 years prior. No permits issued for dock. Spoke with Legal regarding enforcement action. Issued stop work order as work being done requires Minor site plan amendment. Provided resources to owner.
KLWSA
STR PC
Enforcement
Page 119
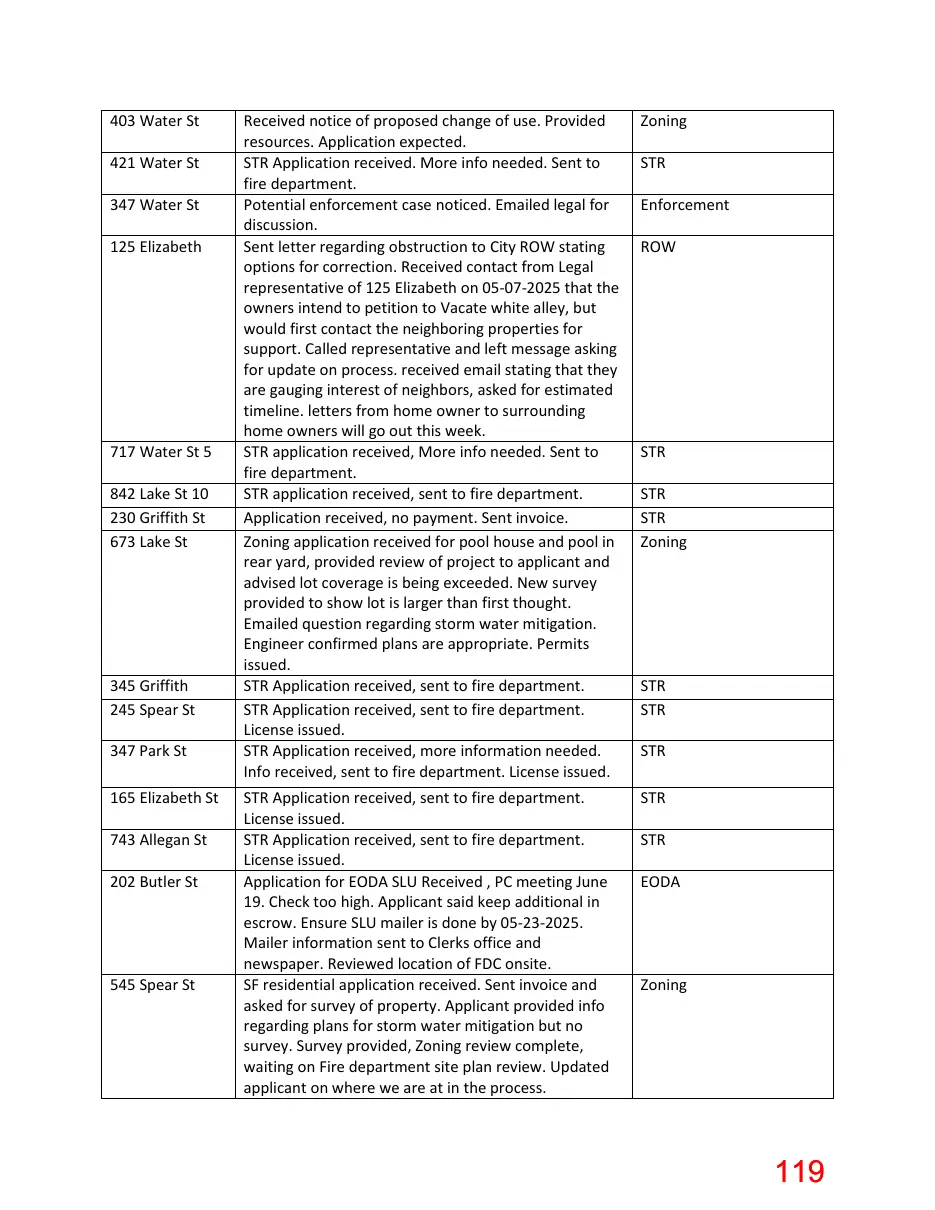
Text of page 119
403 Water St 421 Water St 347 Water St 125 Elizabeth
717 Water St 5 842 Lake St 10 230 Griffith St 673 Lake St
345 Griffith 245 Spear St 347 Park St 165 Elizabeth St 743 Allegan St 202 Butler St
545 Spear St
Received notice of proposed change of use. Provided resources. Application expected. STR Application received. More info needed. Sent to fire department. Potential enforcement case noticed. Emailed legal for discussion. Sent letter regarding obstruction to City ROW stating options for correction. Received contact from Legal representative of 125 Elizabeth on 05-07-2025 that the owners intend to petition to Vacate white alley, but would first contact the neighboring properties for support. Called representative and left message asking for update on process. received email stating that they are gauging interest of neighbors, asked for estimated timeline. letters from home owner to surrounding home owners will go out this week. STR application received, More info needed. Sent to fire department. STR application received, sent to fire department. Application received, no payment. Sent invoice. Zoning application received for pool house and pool in rear yard, provided review of project to applicant and advised lot coverage is being exceeded. New survey provided to show lot is larger than first thought. Emailed question regarding storm water mitigation. Engineer confirmed plans are appropriate. Permits issued. STR Application received, sent to fire department. STR Application received, sent to fire department. License issued. STR Application received, more information needed. Info received, sent to fire department. License issued.
Zoning
STR Application received, sent to fire department. License issued. STR Application received, sent to fire department. License issued. Application for EODA SLU Received , PC meeting June 19. Check too high. Applicant said keep additional in escrow. Ensure SLU mailer is done by 05-23-2025. Mailer information sent to Clerks office and newspaper. Reviewed location of FDC onsite. SF residential application received. Sent invoice and asked for survey of property. Applicant provided info regarding plans for storm water mitigation but no survey. Survey provided, Zoning review complete, waiting on Fire department site plan review. Updated applicant on where we are at in the process.
STR
STR Enforcement ROW
STR STR STR Zoning
STR STR STR
STR EODA
Zoning
Page 120
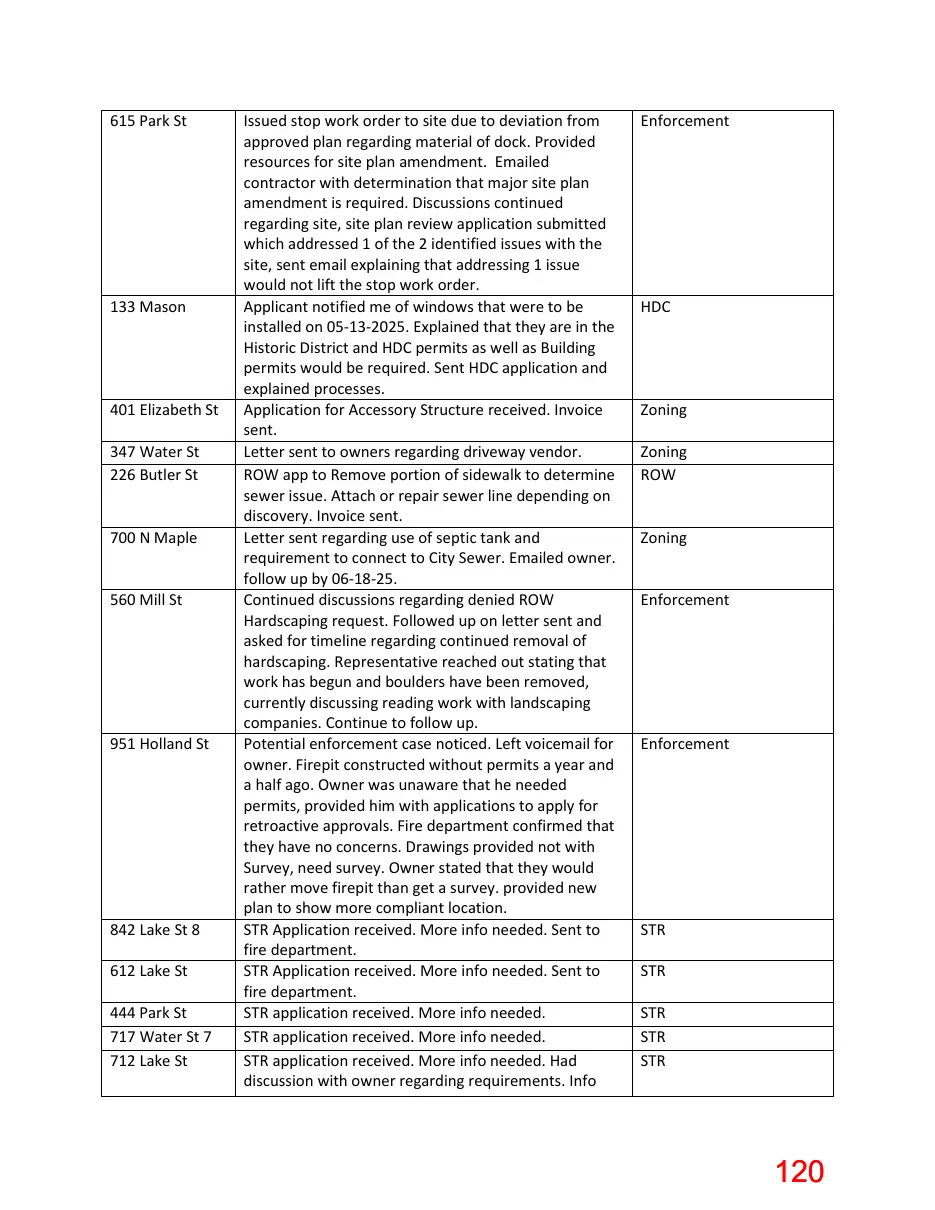
Text of page 120
615 Park St
133 Mason
401 Elizabeth St 347 Water St 226 Butler St 700 N Maple 560 Mill St
951 Holland St
842 Lake St 8 612 Lake St 444 Park St 717 Water St 7 712 Lake St
Issued stop work order to site due to deviation from approved plan regarding material of dock. Provided resources for site plan amendment. Emailed contractor with determination that major site plan amendment is required. Discussions continued regarding site, site plan review application submitted which addressed 1 of the 2 identified issues with the site, sent email explaining that addressing 1 issue would not lift the stop work order. Applicant notified me of windows that were to be installed on 05-13-2025. Explained that they are in the Historic District and HDC permits as well as Building permits would be required. Sent HDC application and explained processes. Application for Accessory Structure received. Invoice sent. Letter sent to owners regarding driveway vendor. ROW app to Remove portion of sidewalk to determine sewer issue. Attach or repair sewer line depending on discovery. Invoice sent. Letter sent regarding use of septic tank and requirement to connect to City Sewer. Emailed owner. follow up by 06-18-25. Continued discussions regarding denied ROW Hardscaping request. Followed up on letter sent and asked for timeline regarding continued removal of hardscaping. Representative reached out stating that work has begun and boulders have been removed, currently discussing reading work with landscaping companies. Continue to follow up. Potential enforcement case noticed. Left voicemail for owner. Firepit constructed without permits a year and a half ago. Owner was unaware that he needed permits, provided him with applications to apply for retroactive approvals. Fire department confirmed that they have no concerns. Drawings provided not with Survey, need survey. Owner stated that they would rather move firepit than get a survey. provided new plan to show more compliant location. STR Application received. More info needed. Sent to fire department. STR Application received. More info needed. Sent to fire department. STR application received. More info needed. STR application received. More info needed. STR application received. More info needed. Had discussion with owner regarding requirements. Info
Enforcement
HDC
Zoning Zoning ROW Zoning Enforcement
Enforcement
STR STR STR STR STR
Page 121
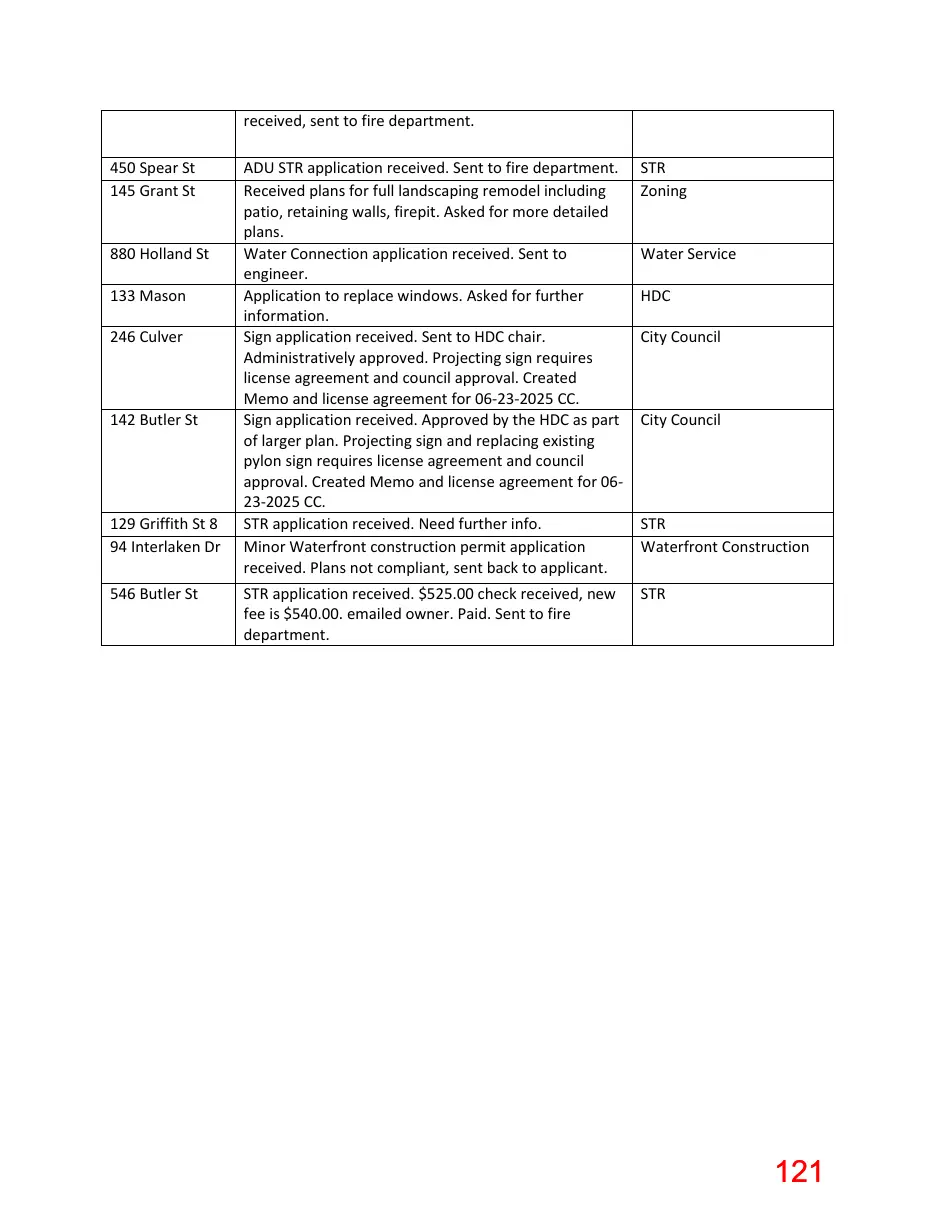
Text of page 121
received, sent to fire department. 450 Spear St 145 Grant St 880 Holland St 133 Mason 246 Culver
142 Butler St
129 Griffith St 8 94 Interlaken Dr 546 Butler St
ADU STR application received. Sent to fire department. Received plans for full landscaping remodel including patio, retaining walls, firepit. Asked for more detailed plans. Water Connection application received. Sent to engineer. Application to replace windows. Asked for further information. Sign application received. Sent to HDC chair. Administratively approved. Projecting sign requires license agreement and council approval. Created Memo and license agreement for 06-23-2025 CC. Sign application received. Approved by the HDC as part of larger plan. Projecting sign and replacing existing pylon sign requires license agreement and council approval. Created Memo and license agreement for 0623-2025 CC. STR application received. Need further info. Minor Waterfront construction permit application received. Plans not compliant, sent back to applicant.
STR Zoning
STR application received. $525.00 check received, new fee is $540.00. emailed owner. Paid. Sent to fire department.
STR
Water Service HDC City Council
City Council
STR Waterfront Construction
Page 122
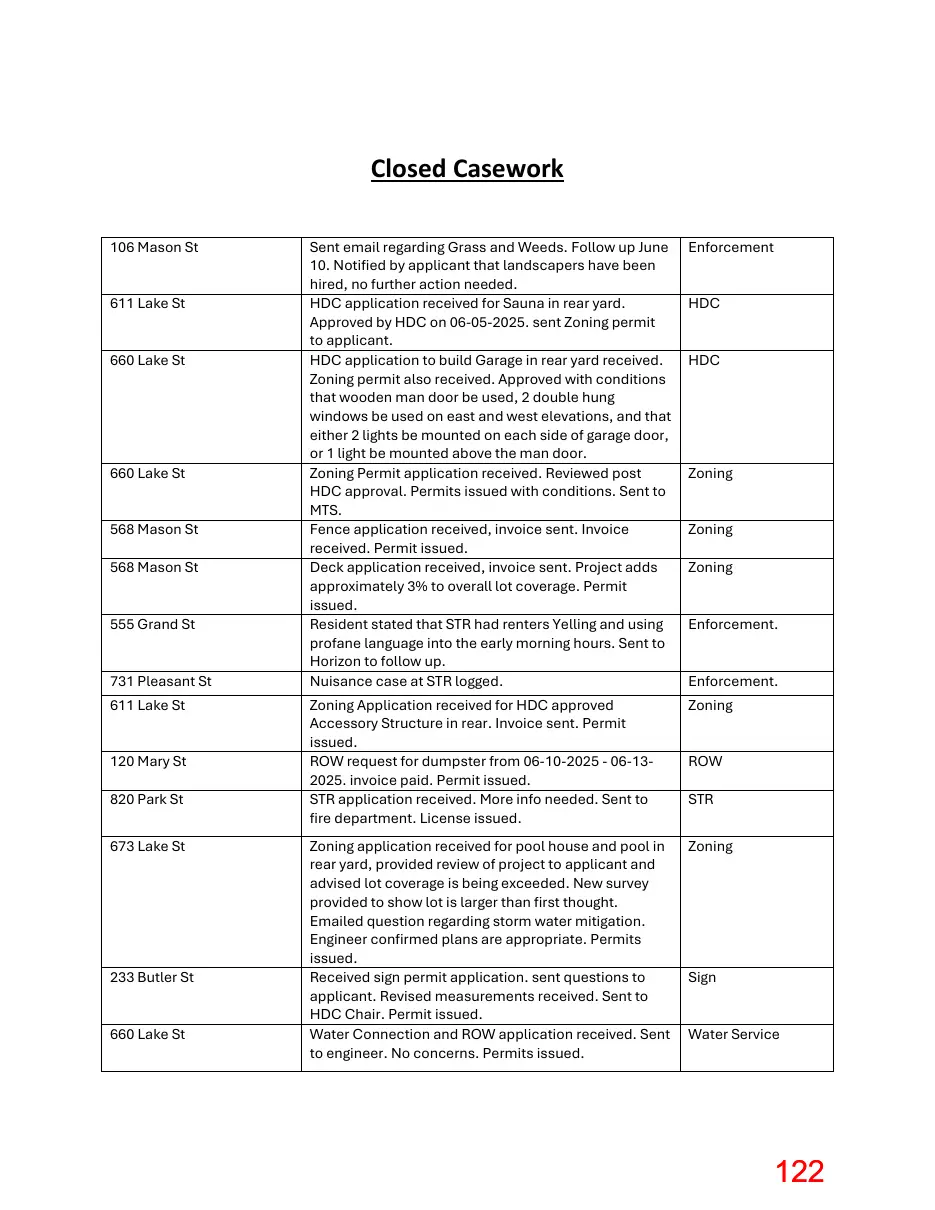
Text of page 122
Closed Casework 106 Mason St 611 Lake St 660 Lake St
660 Lake St 568 Mason St 568 Mason St 555 Grand St 731 Pleasant St 611 Lake St 120 Mary St 820 Park St 673 Lake St
233 Butler St 660 Lake St
Sent email regarding Grass and Weeds. Follow up June 10. Notified by applicant that landscapers have been hired, no further action needed. HDC application received for Sauna in rear yard. Approved by HDC on 06-05-2025. sent Zoning permit to applicant. HDC application to build Garage in rear yard received. Zoning permit also received. Approved with conditions that wooden man door be used, 2 double hung windows be used on east and west elevations, and that either 2 lights be mounted on each side of garage door, or 1 light be mounted above the man door. Zoning Permit application received. Reviewed post HDC approval. Permits issued with conditions. Sent to MTS. Fence application received, invoice sent. Invoice received. Permit issued. Deck application received, invoice sent. Project adds approximately 3% to overall lot coverage. Permit issued. Resident stated that STR had renters Yelling and using profane language into the early morning hours. Sent to Horizon to follow up. Nuisance case at STR logged.
Enforcement
Zoning Application received for HDC approved Accessory Structure in rear. Invoice sent. Permit issued. ROW request for dumpster from 06-10-2025 - 06-132025. invoice paid. Permit issued. STR application received. More info needed. Sent to fire department. License issued.
Zoning
Zoning application received for pool house and pool in rear yard, provided review of project to applicant and advised lot coverage is being exceeded. New survey provided to show lot is larger than first thought. Emailed question regarding storm water mitigation. Engineer confirmed plans are appropriate. Permits issued. Received sign permit application. sent questions to applicant. Revised measurements received. Sent to HDC Chair. Permit issued. Water Connection and ROW application received. Sent to engineer. No concerns. Permits issued.
Zoning
HDC HDC
Zoning Zoning Zoning Enforcement. Enforcement.
ROW STR
Sign Water Service
Page 123
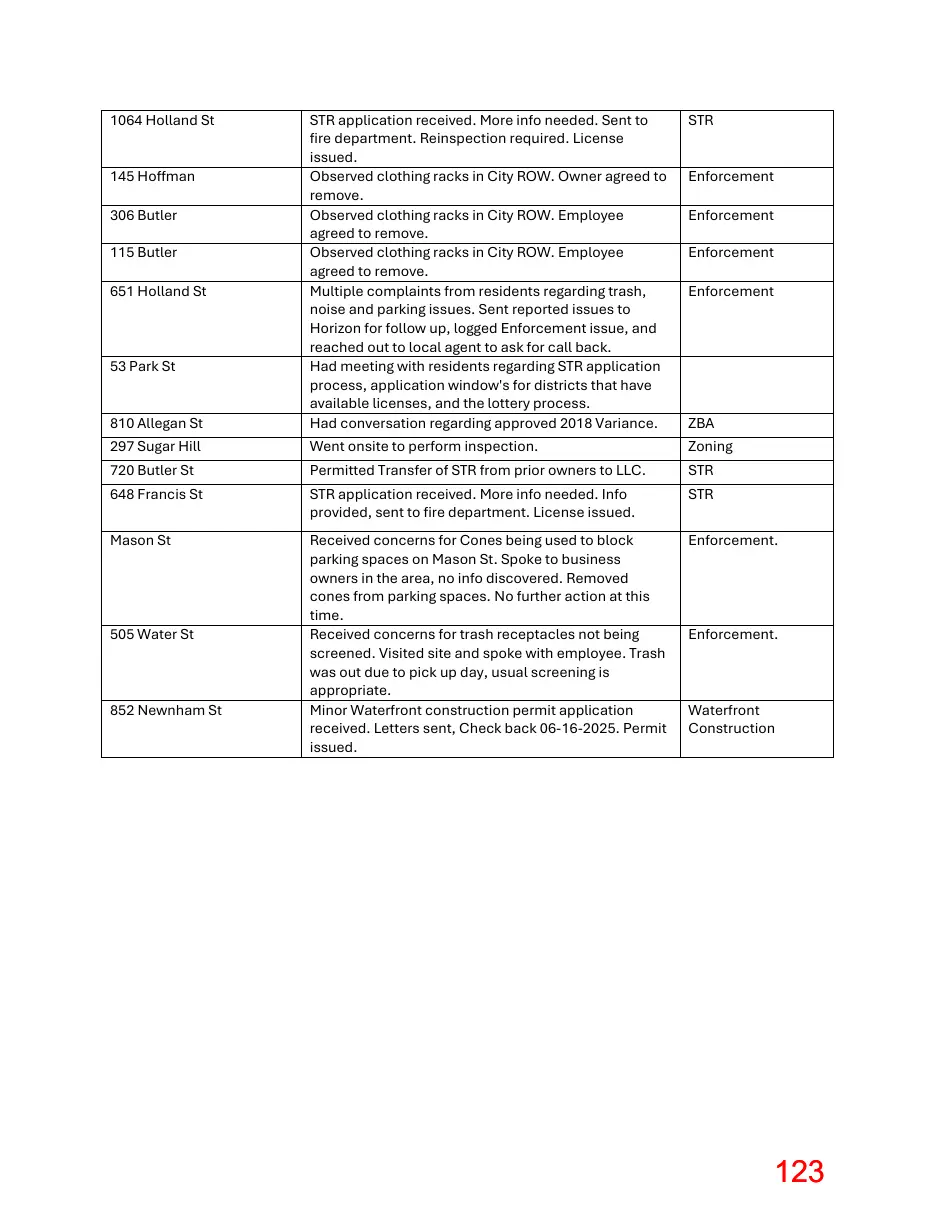
Text of page 123
1064 Holland St
STR
810 Allegan St
STR application received. More info needed. Sent to fire department. Reinspection required. License issued. Observed clothing racks in City ROW. Owner agreed to remove. Observed clothing racks in City ROW. Employee agreed to remove. Observed clothing racks in City ROW. Employee agreed to remove. Multiple complaints from residents regarding trash, noise and parking issues. Sent reported issues to Horizon for follow up, logged Enforcement issue, and reached out to local agent to ask for call back. Had meeting with residents regarding STR application process, application window's for districts that have available licenses, and the lottery process. Had conversation regarding approved 2018 Variance.
297 Sugar Hill
Went onsite to perform inspection.
Zoning
720 Butler St
Permitted Transfer of STR from prior owners to LLC.
STR
648 Francis St
STR application received. More info needed. Info provided, sent to fire department. License issued.
STR
Mason St
Received concerns for Cones being used to block parking spaces on Mason St. Spoke to business owners in the area, no info discovered. Removed cones from parking spaces. No further action at this time. Received concerns for trash receptacles not being screened. Visited site and spoke with employee. Trash was out due to pick up day, usual screening is appropriate. Minor Waterfront construction permit application received. Letters sent, Check back 06-16-2025. Permit issued.
Enforcement.
145 Hoffman 306 Butler 115 Butler 651 Holland St
53 Park St
505 Water St
852 Newnham St
Enforcement Enforcement Enforcement Enforcement
ZBA
Enforcement.
Waterfront Construction
Page 124
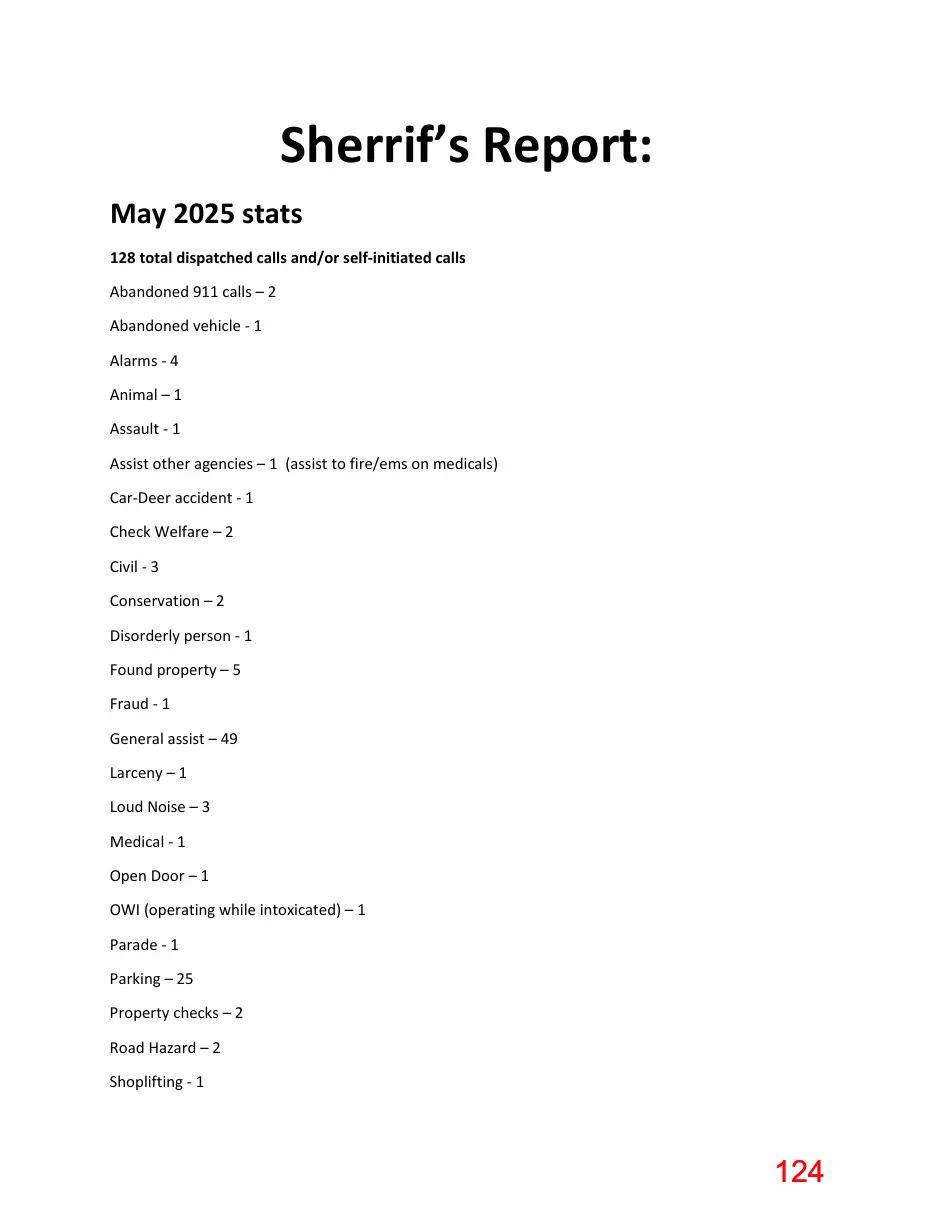
Text of page 124
Sherrif’s Report: May 2025 stats 128 total dispatched calls and/or self-initiated calls Abandoned 911 calls – 2 Abandoned vehicle - 1 Alarms - 4 Animal – 1 Assault - 1 Assist other agencies – 1 (assist to fire/ems on medicals) Car-Deer accident - 1 Check Welfare – 2 Civil - 3 Conservation – 2 Disorderly person - 1 Found property – 5 Fraud - 1 General assist – 49 Larceny – 1 Loud Noise – 3 Medical - 1 Open Door – 1 OWI (operating while intoxicated) – 1 Parade - 1 Parking – 25 Property checks – 2 Road Hazard – 2 Shoplifting - 1
Page 125
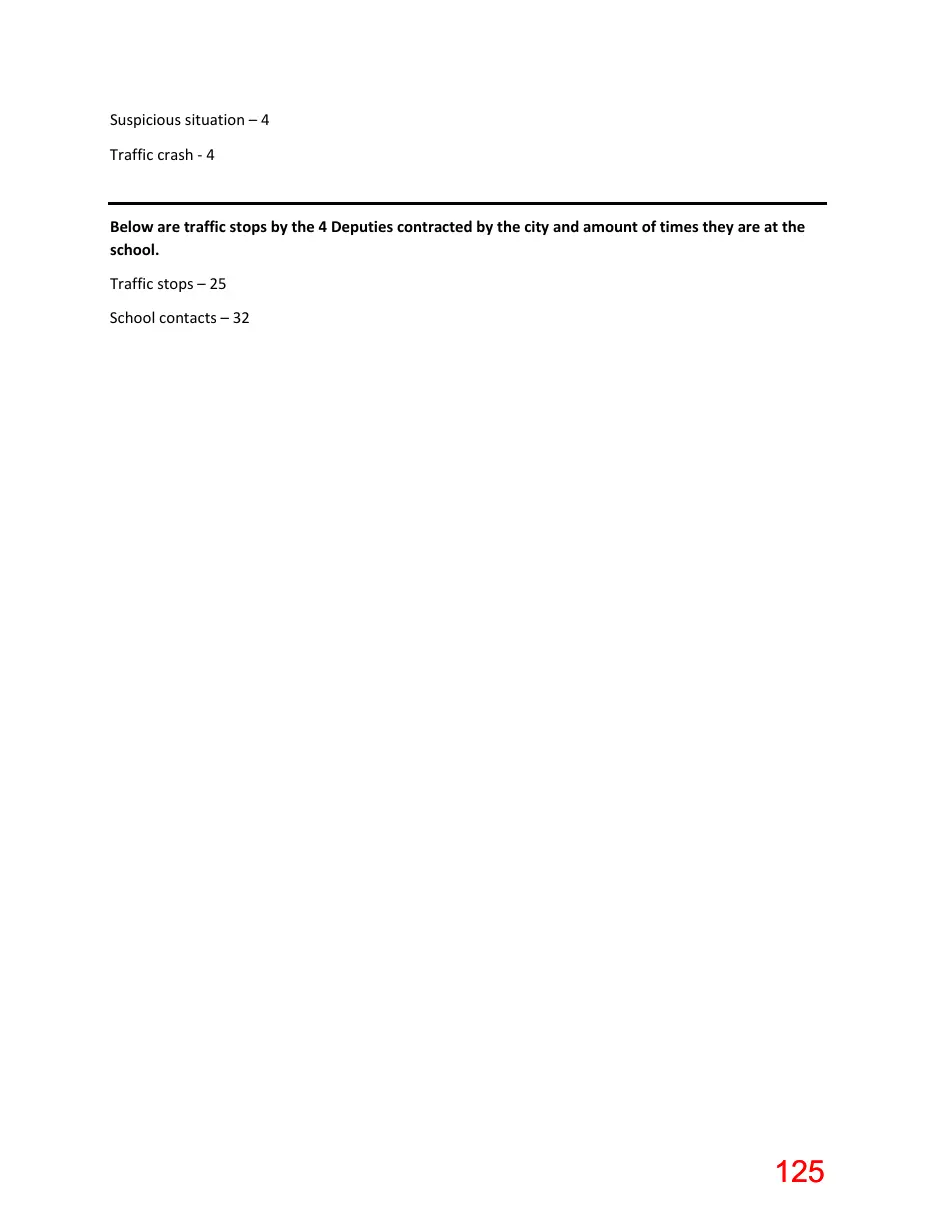
Text of page 125
Suspicious situation – 4 Traffic crash - 4
Below are traffic stops by the 4 Deputies contracted by the city and amount of times they are at the school. Traffic stops – 25 School contacts – 32