
Workshop Agenda item 7A
Parking Study Presentation - Summary, Recommendations, and Action Plan
City Council Workshop, Wednesday, September 23, 2026
Download these 33 pages, 2.7 MB Whole packet, 74 pages, 4.5 MB
Page 7
Text of page 7
City of Saugatuck Parking Study Executive Summary and Action Plan Walker Consultants | September 2026
Prepared with the City of Saugatuck Parking Improvements Task Force
In association with:
Page 8
Text of page 8
Agenda 1
Study Purpose, Scope, and Approach
What the Data and Input Show
Supply and Pricing Options
Management and Access Improvements
Recommended Strategic Direction
Implementation and Timeline 8
Page 9
Text of page 9
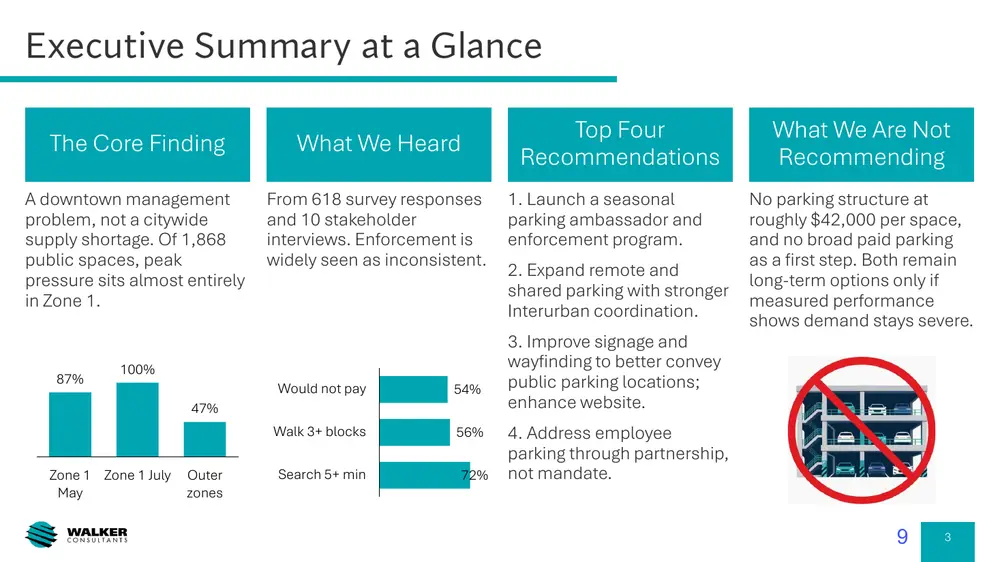
Executive Summary at a Glance The Core Finding
What We Heard
A downtown management problem, not a citywide supply shortage. Of 1,868 public spaces, peak pressure sits almost entirely in Zone 1.
From 618 survey responses and 10 stakeholder interviews. Enforcement is widely seen as inconsistent.
87%
100% Would not pay
54%
Walk 3+ blocks
56%
Search 5+ min
72%
47%
Zone 1 Zone 1 July May
Outer zones
Top Four Recommendations 1. Launch a seasonal parking ambassador and enforcement program. 2. Expand remote and shared parking with stronger Interurban coordination. 3. Improve signage and wayfinding to better convey public parking locations; enhance website.
What We Are Not Recommending No parking structure at roughly $42,000 per space, and no broad paid parking as a first step. Both remain long-term options only if measured performance shows demand stays severe.
4. Address employee parking through partnership, not mandate.
Page 10
Text of page 10
Study Purpose, Scope, and Approach
Page 11
Text of page 11
Guiding Principles Behind the Plan
Optimize First
Prioritize the Curb
Partner, Don't Mandate
Use existing assets harder — enforcement, turnover, remote and shared parking, signage — before expanding supply.
Reserve the most convenient spaces for customers, visitors, accessible users, and quickturnover activity through managed time limits.
Work with employers on employee parking, expand accessible space count, and reserve the closest curb spaces for customers and accessible users.
Manage by Data Align solutions with fiscal capacity, preserve Saugatuck's character, and let measured performance drive future decisions.
The through-line: manage what already exists, protect the curb for customers and accessible users, and let measured performance drive any capital decision.
Page 12
Text of page 12
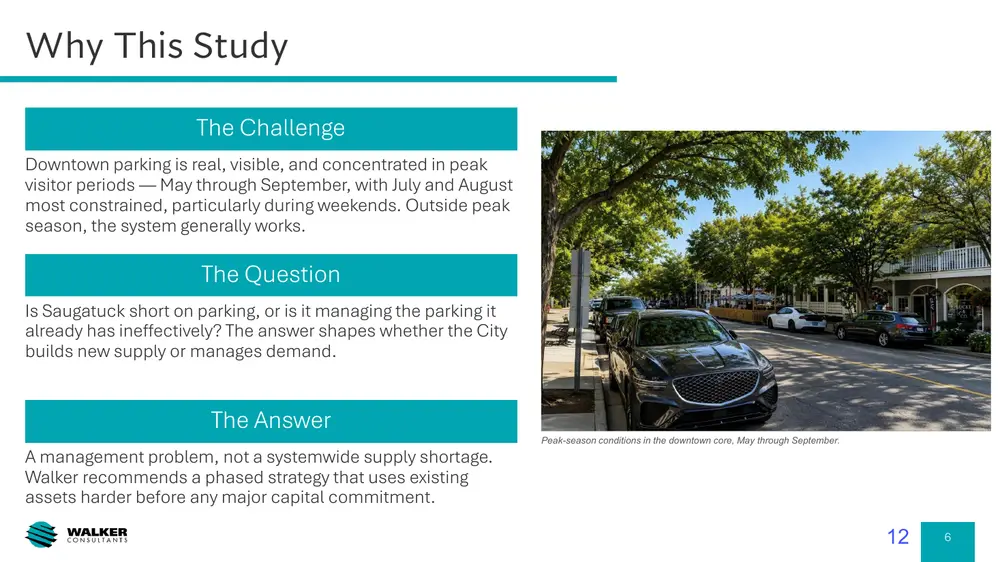
Why This Study The Challenge Downtown parking is real, visible, and concentrated in peak visitor periods — May through September, with July and August most constrained, particularly during weekends. Outside peak season, the system generally works.
The Question Is Saugatuck short on parking, or is it managing the parking it already has ineffectively? The answer shapes whether the City builds new supply or manages demand.
The Answer A management problem, not a systemwide supply shortage. Walker recommends a phased strategy that uses existing assets harder before any major capital commitment.
Peak-season conditions in the downtown core, May through September.
Page 13
Text of page 13
Study Scope and Methodology Timeframe
Study Area
Field Work
Stakeholder Input
Began late summer 2025, concluding summer 2026. Designed to capture both off-season and peak-season conditions.
Four zones: CBD, The Hill, North Residential, and South Residential. Inventory and occupancy covered all four.
Inventory and mapping of publicly available parking, including publiclyand privately-owned public parking, posted restrictions, transit stops, bike facilities, loading areas, curbside conditions, and ADA spaces. Parking occupancy studies in the core during off-season and peak-season conditions.
Eight Parking Improvements Task Force (PITF) meetings guided by nine City of Saugatuck PITF members, each with public comment
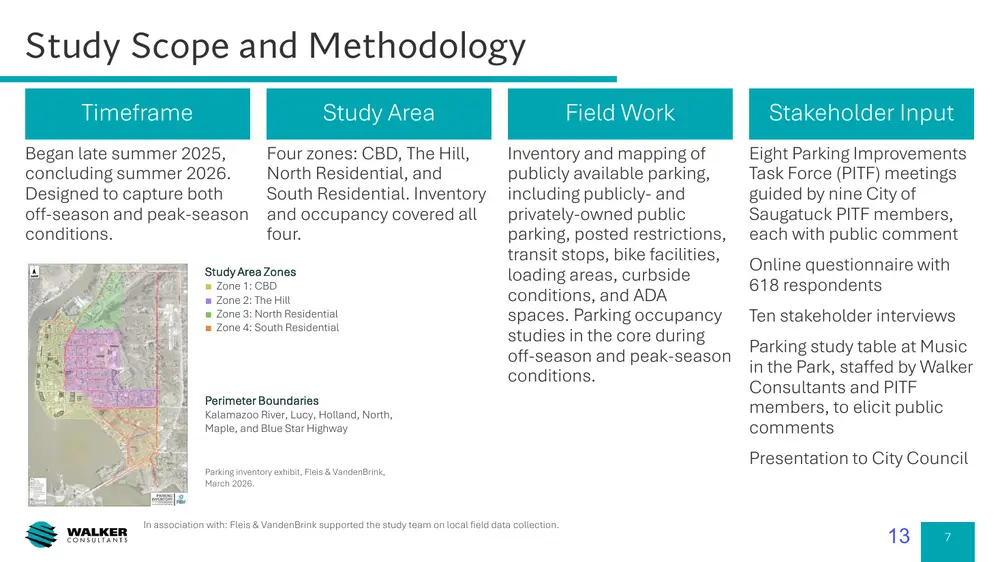
Study Area Zones
■ Zone 1: CBD ■ Zone 2: The Hill ■ Zone 3: North Residential ■ Zone 4: South Residential
Perimeter Boundaries
Kalamazoo River, Lucy, Holland, North, Maple, and Blue Star Highway
Parking inventory exhibit, Fleis & VandenBrink, March 2026.
In association with: Fleis & VandenBrink supported the study team on local field data collection.
Online questionnaire with 618 respondents Ten stakeholder interviews Parking study table at Music in the Park, staffed by Walker Consultants and PITF members, to elicit public comments Presentation to City Council
Page 14
Text of page 14
What the Data and Input Show
Page 15
Text of page 15
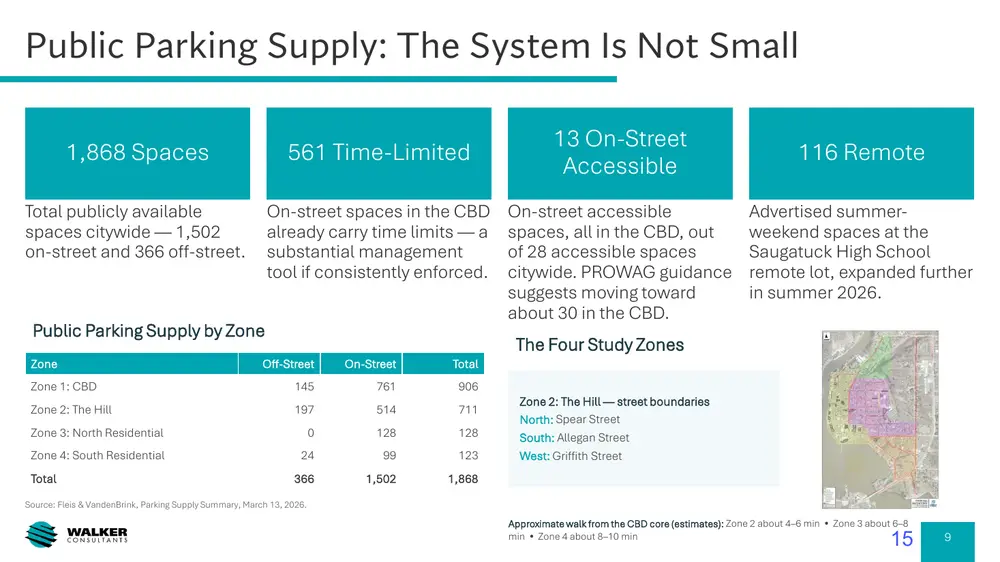
Public Parking Supply: The System Is Not Small 1,868 Spaces
561 Time-Limited
Total publicly available spaces citywide — 1,502 on-street and 366 off-street.
On-street spaces in the CBD already carry time limits — a substantial management tool if consistently enforced.
Public Parking Supply by Zone Zone
13 On-Street Accessible On-street accessible spaces, all in the CBD, out of 28 accessible spaces citywide. PROWAG guidance suggests moving toward about 30 in the CBD.
116 Remote Advertised summerweekend spaces at the Saugatuck High School remote lot, expanded further in summer 2026.
The Four Study Zones
Off-Street
On-Street
Total
Zone 1: CBD
Zone 2: The Hill
Zone 3: North Residential
Zone 4: South Residential
Total
1,502
1,868
Zone 2: The Hill — street boundaries North: Spear Street South: Allegan Street West: Griffith Street
Source: Fleis & VandenBrink, Parking Supply Summary, March 13, 2026.
Approximate walk from the CBD core (estimates): Zone 2 about 4–6 min • Zone 3 about 6–8 min • Zone 4 about 8–10 min
Page 16
Text of page 16
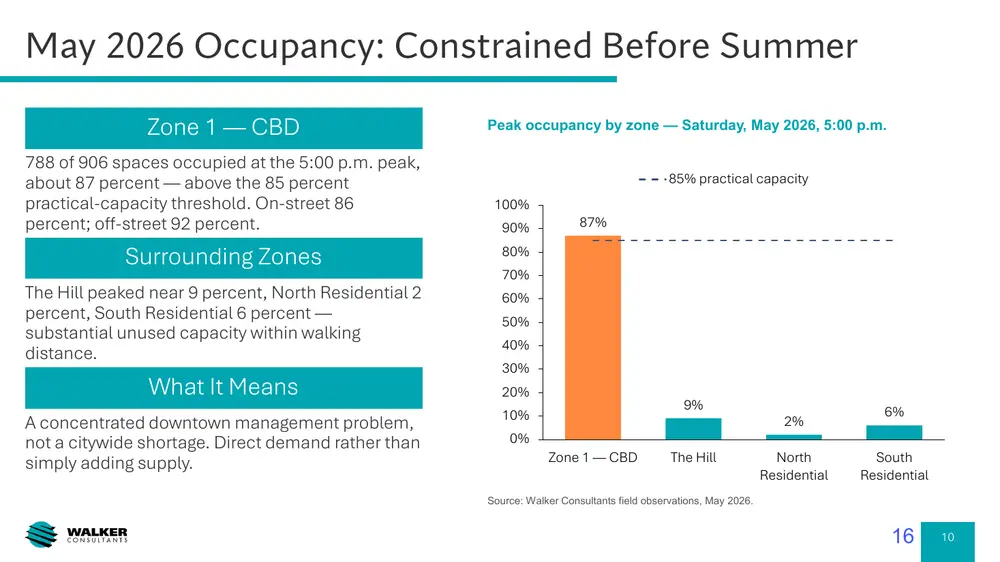
May 2026 Occupancy: Constrained Before Summer Zone 1 — CBD 788 of 906 spaces occupied at the 5:00 p.m. peak, about 87 percent — above the 85 percent practical-capacity threshold. On-street 86 percent; off-street 92 percent.
Surrounding Zones The Hill peaked near 9 percent, North Residential 2 percent, South Residential 6 percent — substantial unused capacity within walking distance.
What It Means A concentrated downtown management problem, not a citywide shortage. Direct demand rather than simply adding supply.
Peak occupancy by zone — Saturday, May 2026, 5:00 p.m. 85% practical capacity 100% 90%
87%
80% 70% 60% 50% 40% 30% 20%
10% 0% Zone 1 — CBD
The Hill
2% North Residential
6% South Residential
Source: Walker Consultants field observations, May 2026.
Page 17
Text of page 17
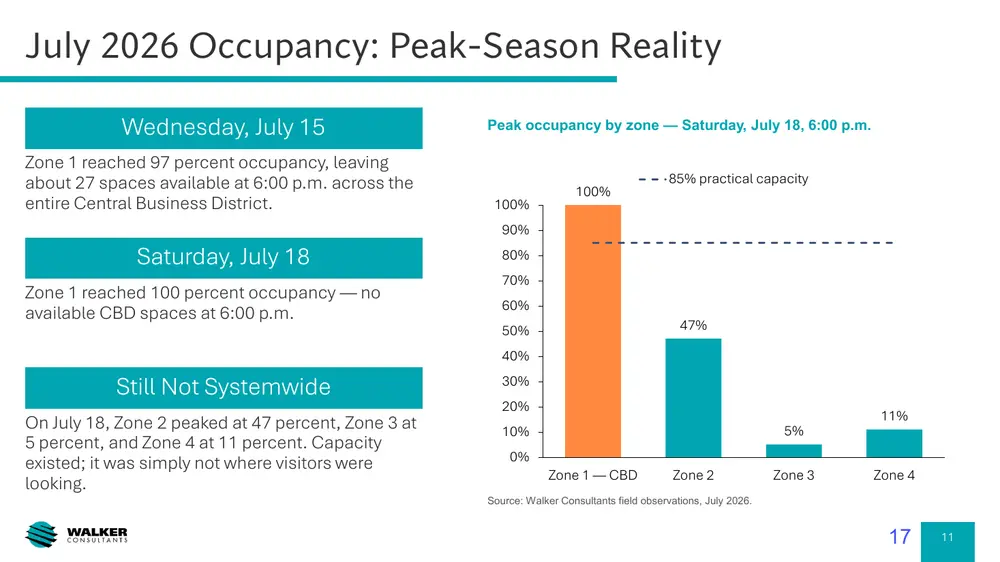
July 2026 Occupancy: Peak-Season Reality Wednesday, July 15 Zone 1 reached 97 percent occupancy, leaving about 27 spaces available at 6:00 p.m. across the entire Central Business District.
Peak occupancy by zone — Saturday, July 18, 6:00 p.m.
100%
100%
85% practical capacity
90%
Saturday, July 18 Zone 1 reached 100 percent occupancy — no available CBD spaces at 6:00 p.m.
80% 70% 60% 47%
50% 40%
Still Not Systemwide On July 18, Zone 2 peaked at 47 percent, Zone 3 at 5 percent, and Zone 4 at 11 percent. Capacity existed; it was simply not where visitors were looking.
30% 20% 5%
10%
11%
0% Zone 1 — CBD
Zone 2
Zone 3
Zone 4
Source: Walker Consultants field observations, July 2026.
Page 18
Text of page 18
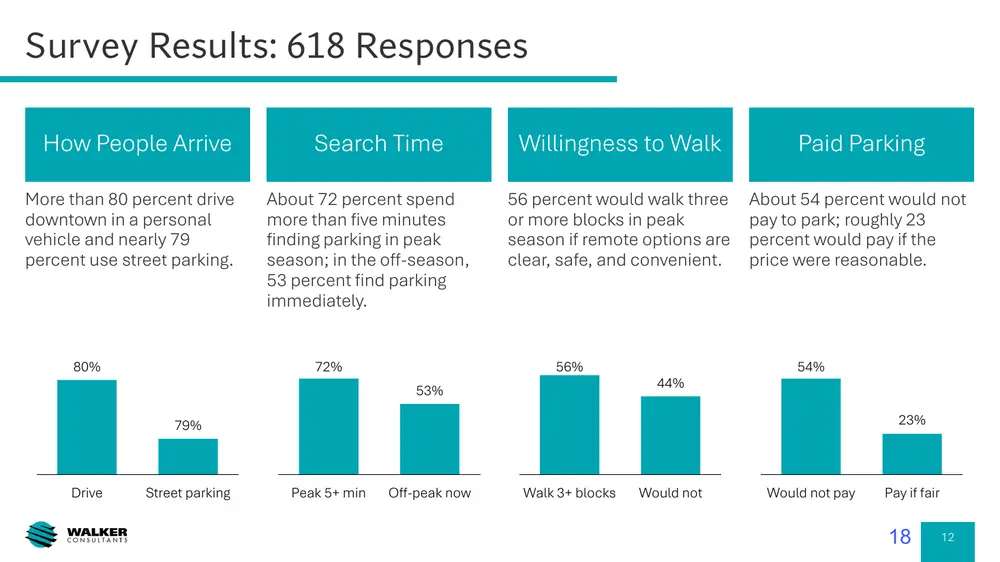
Survey Results: 618 Responses How People Arrive
Search Time
Willingness to Walk
Paid Parking
More than 80 percent drive downtown in a personal vehicle and nearly 79 percent use street parking.
About 72 percent spend more than five minutes finding parking in peak season; in the off-season, 53 percent find parking immediately.
56 percent would walk three or more blocks in peak season if remote options are clear, safe, and convenient.
About 54 percent would not pay to park; roughly 23 percent would pay if the price were reasonable.
80%
72%
56% 53%
44%
54% 23%
79%
Drive
Street parking
Peak 5+ min
Off-peak now
Walk 3+ blocks
Would not
Would not pay
Pay if fair
Page 19
Text of page 19
Stakeholder Feedback: 10 Interviews Points of Agreement
Shared Assets
No Consensus on Building
Enforcement is minimal or inconsistent, posted time limits lose credibility, and signage, maps, and website information need real improvement.
Remote parking and the Interurban are valued, but need clearer promotion, more predictable service, and stronger coordination with additional lots.
Stakeholders did not coalesce around a garage, citing cost, seasonal use, aesthetics, site availability, and effects on Saugatuck's character.
Who We Heard From The ten interviews represented lodging, marina, and visitor-serving operators, the school district, and civic and arts organizations. The Parking Improvements Task Force brought together city officials, city staff, Interurban Transit, downtown business representatives, and residents.
Page 20
Text of page 20
Supply and Pricing Options
Page 21
Text of page 21
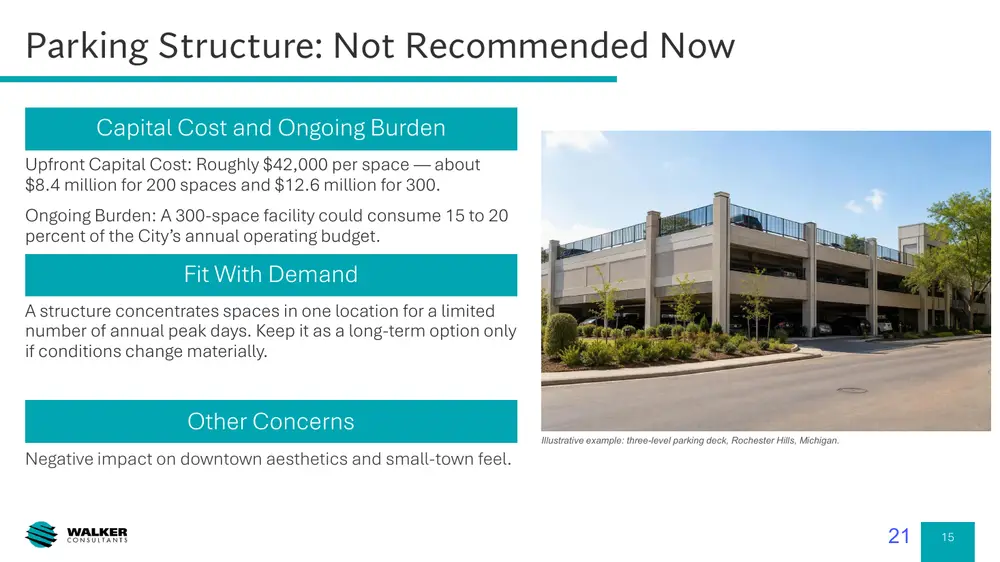
Parking Structure: Not Recommended Now Capital Cost and Ongoing Burden Upfront Capital Cost: Roughly $42,000 per space — about $8.4 million for 200 spaces and $12.6 million for 300. Ongoing Burden: A 300-space facility could consume 15 to 20 percent of the City’s annual operating budget.
Fit With Demand A structure concentrates spaces in one location for a limited number of annual peak days. Keep it as a long-term option only if conditions change materially.
Other Concerns
Illustrative example: three-level parking deck, Rochester Hills, Michigan.
Negative impact on downtown aesthetics and small-town feel.
Page 22
Text of page 22
Paid Parking: A Possible Future Tool, Not Now What It Could Do Improve turnover, generate revenue, provide better data, and reduce reliance on punitive enforcement.
What It Raises Political, customer-service, equity, technology, maintenance, and streetscape concerns — with 54 percent of respondents unwilling to pay.
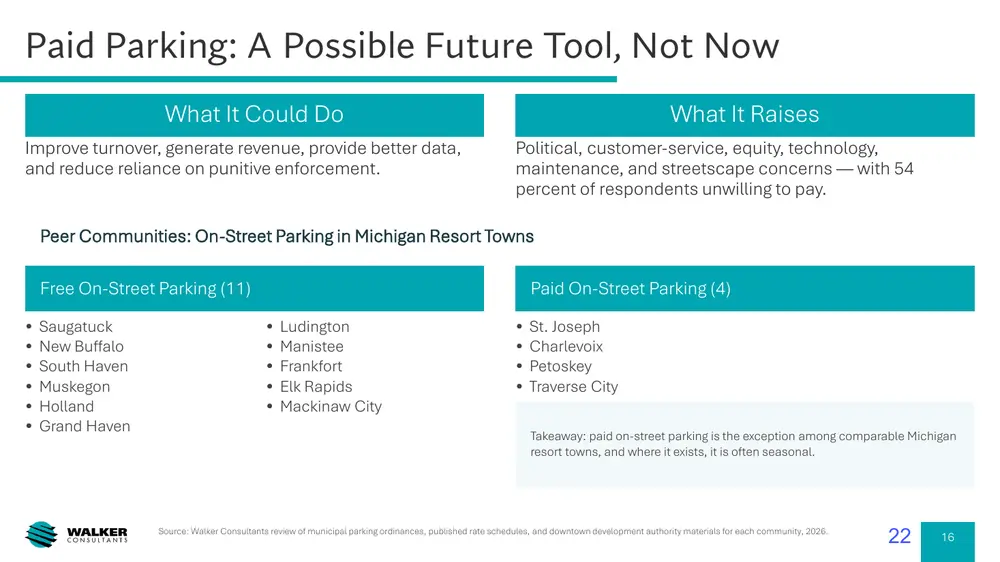
Peer Communities: On-Street Parking in Michigan Resort Towns Free On-Street Parking (11) • Saugatuck • New Buffalo • South Haven • Muskegon • Holland • Grand Haven
Paid On-Street Parking (4) • Ludington • Manistee • Frankfort • Elk Rapids • Mackinaw City
• St. Joseph • Charlevoix • Petoskey • Traverse City Takeaway: paid on-street parking is the exception among comparable Michigan resort towns, and where it exists, it is often seasonal.
Source: Walker Consultants review of municipal parking ordinances, published rate schedules, and downtown development authority materials for each community, 2026.
Page 23
Text of page 23
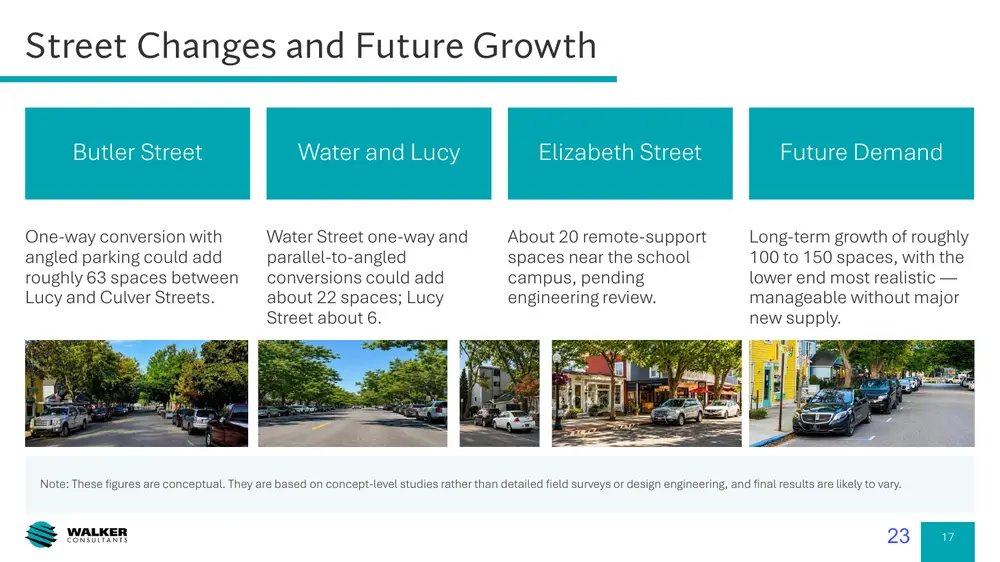
Street Changes and Future Growth Butler Street
Water and Lucy
Elizabeth Street
Future Demand
One-way conversion with angled parking could add roughly 63 spaces between Lucy and Culver Streets.
Water Street one-way and parallel-to-angled conversions could add about 22 spaces; Lucy Street about 6.
About 20 remote-support spaces near the school campus, pending engineering review.
Long-term growth of roughly 100 to 150 spaces, with the lower end most realistic — manageable without major new supply.
Note: These figures are conceptual. They are based on concept-level studies rather than detailed field surveys or design engineering, and final results are likely to vary.
Page 24
Text of page 24
Management and Access Improvements
Page 25
Text of page 25
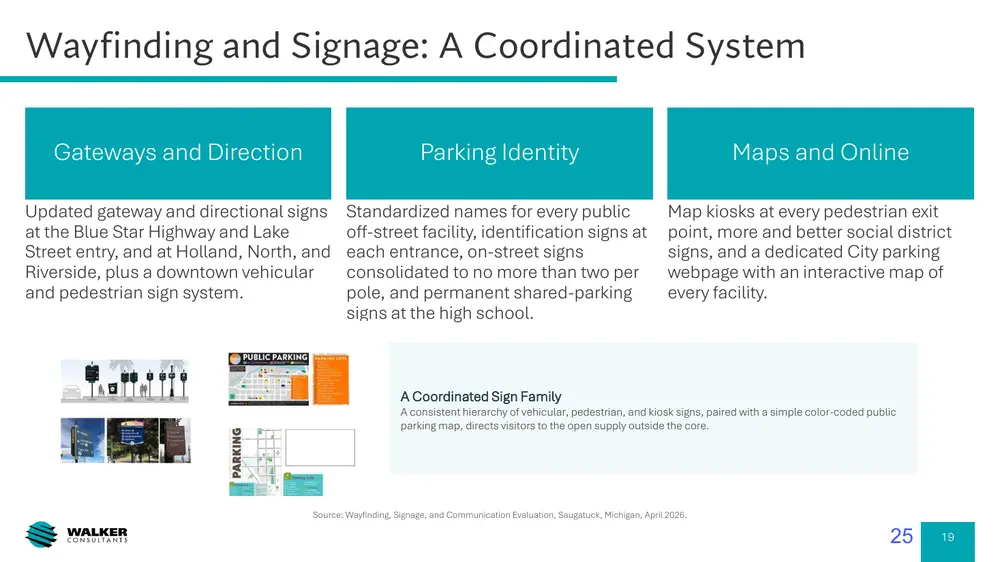
Wayfinding and Signage: A Coordinated System Gateways and Direction
Parking Identity
Maps and Online
Updated gateway and directional signs at the Blue Star Highway and Lake Street entry, and at Holland, North, and Riverside, plus a downtown vehicular and pedestrian sign system.
Standardized names for every public off-street facility, identification signs at each entrance, on-street signs consolidated to no more than two per pole, and permanent shared-parking signs at the high school.
Map kiosks at every pedestrian exit point, more and better social district signs, and a dedicated City parking webpage with an interactive map of every facility.
A Coordinated Sign Family
A consistent hierarchy of vehicular, pedestrian, and kiosk signs, paired with a simple color-coded public parking map, directs visitors to the open supply outside the core.
Source: Wayfinding, Signage, and Communication Evaluation, Saugatuck, Michigan, April 2026.
Page 26
Text of page 26
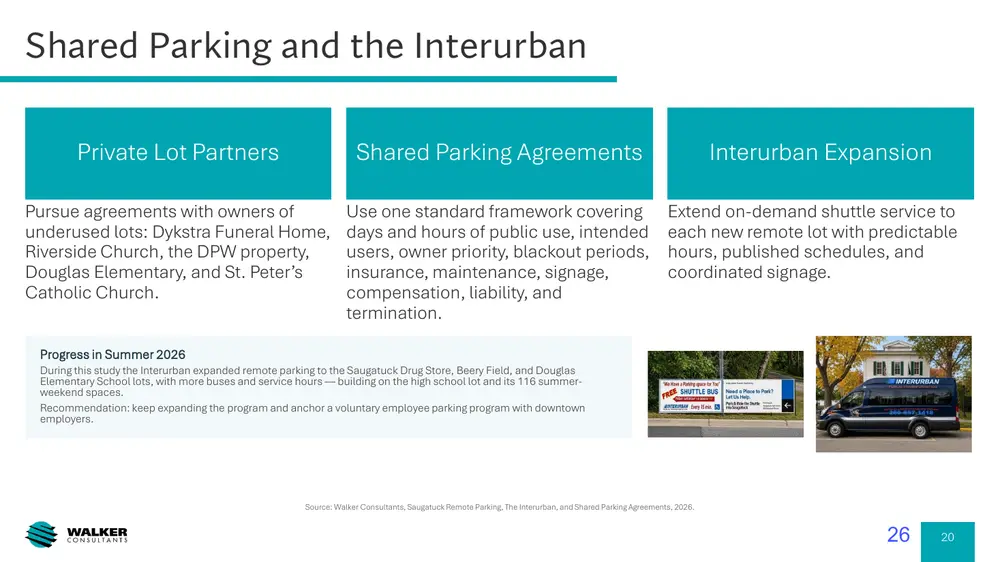
Shared Parking and the Interurban Private Lot Partners
Shared Parking Agreements
Interurban Expansion
Pursue agreements with owners of underused lots: Dykstra Funeral Home, Riverside Church, the DPW property, Douglas Elementary, and St. Peter’s Catholic Church.
Use one standard framework covering days and hours of public use, intended users, owner priority, blackout periods, insurance, maintenance, signage, compensation, liability, and termination.
Extend on-demand shuttle service to each new remote lot with predictable hours, published schedules, and coordinated signage.
Progress in Summer 2026 During this study the Interurban expanded remote parking to the Saugatuck Drug Store, Beery Field, and Douglas Elementary School lots, with more buses and service hours — building on the high school lot and its 116 summerweekend spaces. Recommendation: keep expanding the program and anchor a voluntary employee parking program with downtown employers.
Source: Walker Consultants, Saugatuck Remote Parking, The Interurban, and Shared Parking Agreements, 2026.
Page 27
Text of page 27
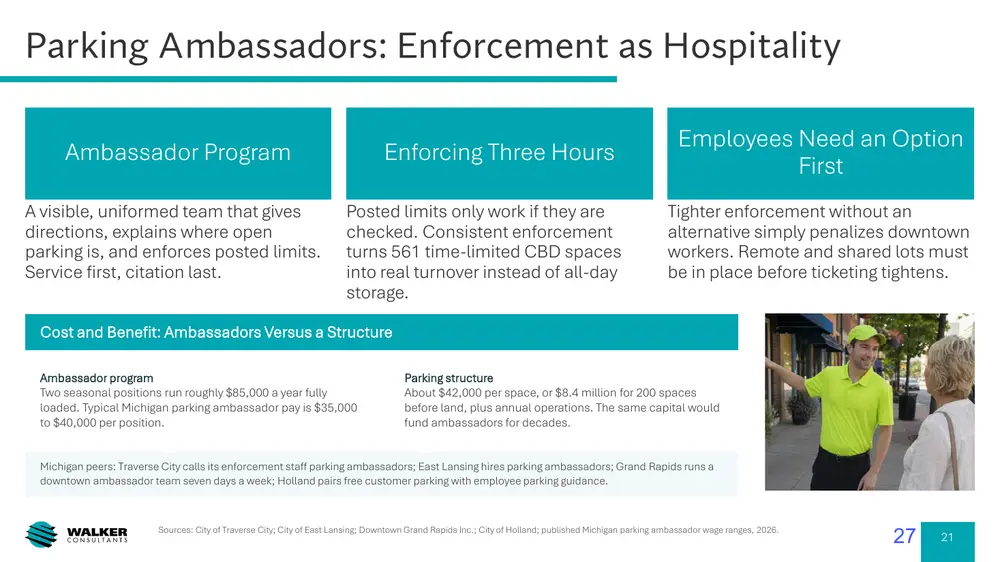
Parking Ambassadors: Enforcement as Hospitality Ambassador Program A visible, uniformed team that gives directions, explains where open parking is, and enforces posted limits. Service first, citation last.
Enforcing Three Hours Posted limits only work if they are checked. Consistent enforcement turns 561 time-limited CBD spaces into real turnover instead of all-day storage.
Employees Need an Option First Tighter enforcement without an alternative simply penalizes downtown workers. Remote and shared lots must be in place before ticketing tightens.
Cost and Benefit: Ambassadors Versus a Structure Ambassador program Two seasonal positions run roughly $85,000 a year fully loaded. Typical Michigan parking ambassador pay is $35,000 to $40,000 per position.
Parking structure About $42,000 per space, or $8.4 million for 200 spaces before land, plus annual operations. The same capital would fund ambassadors for decades.
Michigan peers: Traverse City calls its enforcement staff parking ambassadors; East Lansing hires parking ambassadors; Grand Rapids runs a downtown ambassador team seven days a week; Holland pairs free customer parking with employee parking guidance.
Sources: City of Traverse City; City of East Lansing; Downtown Grand Rapids Inc.; City of Holland; published Michigan parking ambassador wage ranges, 2026.
Page 28
Text of page 28
Employee Parking: Partnership, Not Mandate The Pattern
The Scale
Why Not a Mandate
Many downtown businesses have no dedicated employee parking, so employees park wherever space exists — Butler, Water, the side streets, the hill, church lots, and the high school lot.
Peak-season shifts at individual businesses range from 10 to 15 employees up to 50 during the day and 75 at night, consuming prime customer spaces for the whole shift.
Stakeholders repeatedly said the high school lot is unworkable or goes unused, citing shuttle hours, lighting, and late-night safety. A rule without a workable alternative just moves the problem to nearby streets.
A Voluntary Program, Piloted First Work with downtown employers to document peak-season staffing, where employees park today, shift times, loading needs, and safety concerns. Match those needs to remote and shared lots with Interurban service that actually covers shift ends. Launch a small pilot with willing employers, backed by real incentives — free or discounted permits, guaranteed remote spaces, extended shuttle hours, and better lighting — and measure how many prime spaces it frees before scaling. Source: Employee parking survey of the downtown business community, stakeholder engagement, and remote parking analysis. Walker Consultants with Fleis & VandenBrink and the Parking Improvements Task Force, 2026.
Page 29
Text of page 29
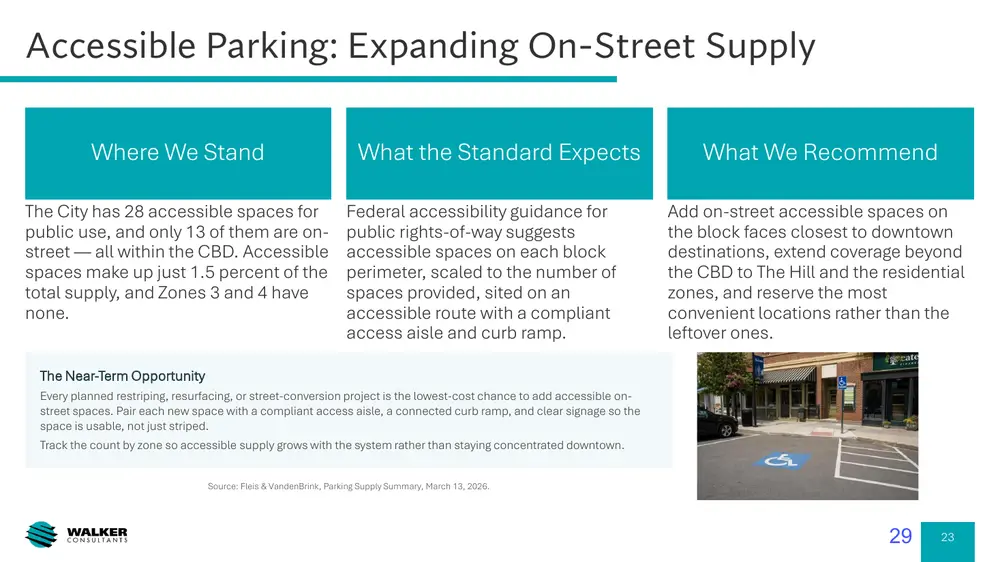
Accessible Parking: Expanding On-Street Supply Where We Stand The City has 28 accessible spaces for public use, and only 13 of them are onstreet — all within the CBD. Accessible spaces make up just 1.5 percent of the total supply, and Zones 3 and 4 have none.
What the Standard Expects Federal accessibility guidance for public rights-of-way suggests accessible spaces on each block perimeter, scaled to the number of spaces provided, sited on an accessible route with a compliant access aisle and curb ramp.
What We Recommend Add on-street accessible spaces on the block faces closest to downtown destinations, extend coverage beyond the CBD to The Hill and the residential zones, and reserve the most convenient locations rather than the leftover ones.
The Near-Term Opportunity Every planned restriping, resurfacing, or street-conversion project is the lowest-cost chance to add accessible onstreet spaces. Pair each new space with a compliant access aisle, a connected curb ramp, and clear signage so the space is usable, not just striped. Track the count by zone so accessible supply grows with the system rather than staying concentrated downtown. Source: Fleis & VandenBrink, Parking Supply Summary, March 13, 2026.
Page 30
Text of page 30
What a Public Parking Space Is Worth The Approach
The Illustrative Math
What It Implies
Divide the estimated annual value of downtown goods and services by the public parking supply across the four zones. This is not what users pay for parking, which is commonly subsidized; cost is a floor, not full public value.
An illustrative $200 million in annual downtown sales across 1,883 public spaces yields about $106,000 in gross annual value per space. A 10 to 15 percent business margin puts the adjusted value at roughly $10,600 to $15,900 per space a year.
The current $200 monthly fee is about $2,400 per space a year — roughly a fifth to a quarter of that adjusted value. Across 13 spaces the gap is on the order of $105,000 to $175,000 a year.
Reading the Numbers These figures are illustrative, built on an assumed downtown sales value — a way to frame the magnitude of the public interest in a curb space, not an appraisal. The $200 million assumption and the margin range should be tested against local sales data before any fee is set. Used as a policy input, the analysis supports pricing outdoor dining use closer to the value of the space it displaces, rather than at a flat rate set to recover the cost of providing parking. Source: Walker Consultants, Restaurant Use of On-Street Parking — parking-space value analysis, using illustrative assumptions of $200 million in annual downtown goods and services and 1,883 public spaces.
Page 31
Text of page 31
Recommended Strategic Direction
Page 32
Text of page 32
Recommendations 1–6 1
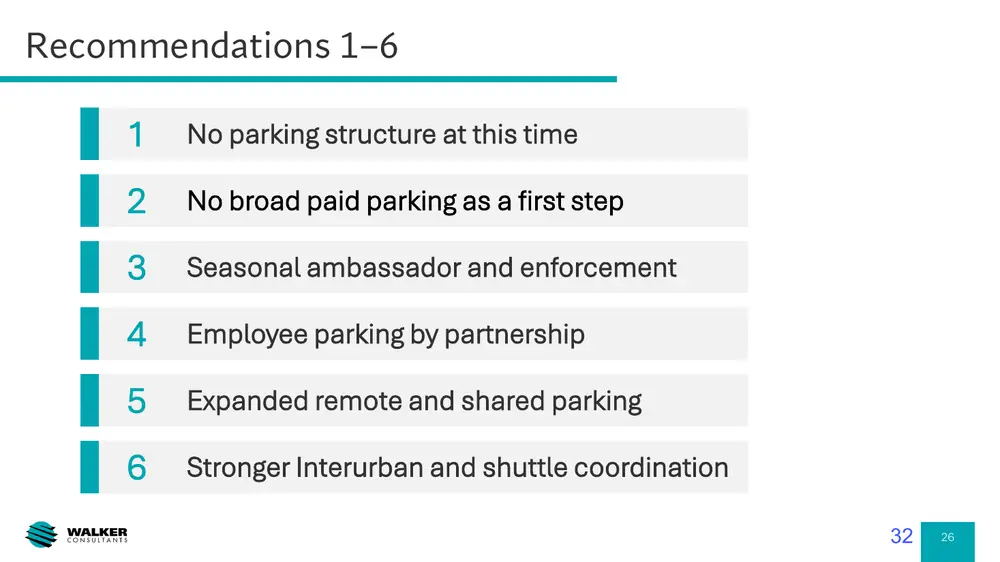
No parking structure at this time
No broad paid parking as a first step
Seasonal ambassador and enforcement
Employee parking by partnership
Expanded remote and shared parking
Stronger Interurban and shuttle coordination 32
Page 33
Text of page 33
Recommendations 7–11 7
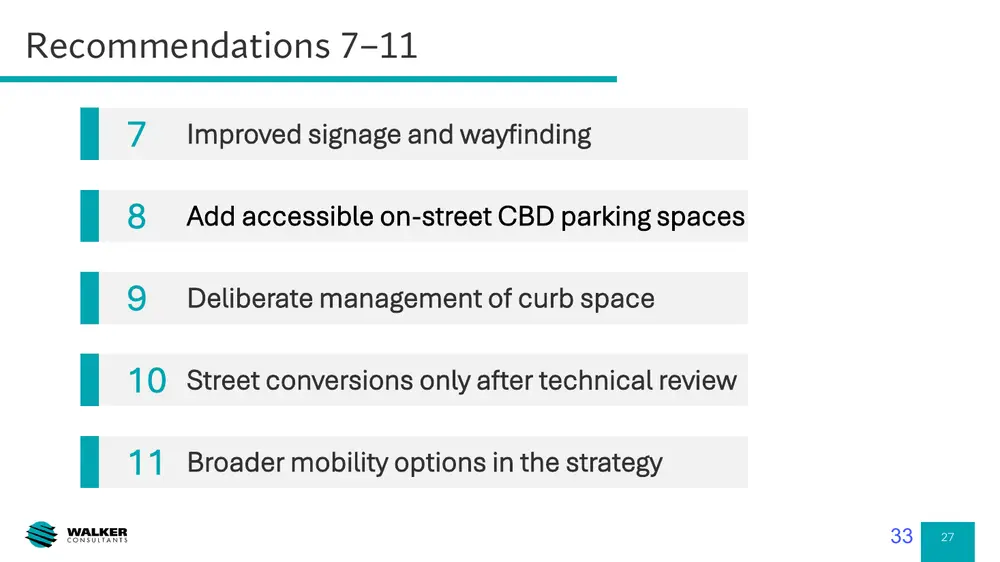
Improved signage and wayfinding
Add accessible on-street CBD parking spaces
Deliberate management of curb space
10 Street conversions only after technical review 11 Broader mobility options in the strategy 33
Page 34
Text of page 34
Implementation and Timeline
Page 35
Text of page 35
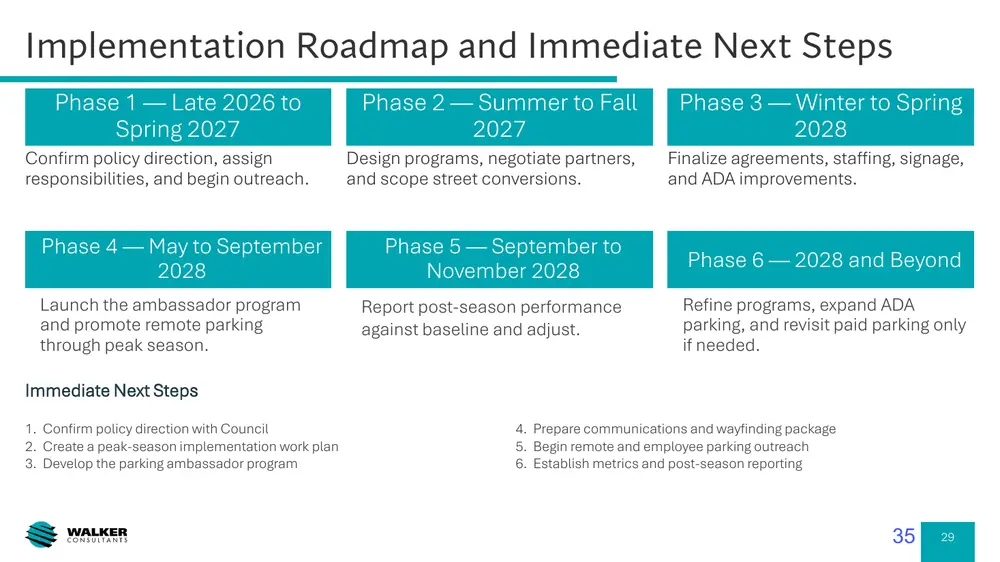
Implementation Roadmap and Immediate Next Steps Phase 1 — Late 2026 to Spring 2027
Phase 2 — Summer to Fall 2027
Phase 3 — Winter to Spring 2028
Confirm policy direction, assign responsibilities, and begin outreach.
Design programs, negotiate partners, and scope street conversions.
Finalize agreements, staffing, signage, and ADA improvements.
Phase 4 — May to September 2028
Phase 5 — September to November 2028
Phase 6 — 2028 and Beyond
Launch the ambassador program and promote remote parking through peak season.
Report post-season performance against baseline and adjust.
Refine programs, expand ADA parking, and revisit paid parking only if needed.
Immediate Next Steps 1. Confirm policy direction with Council 2. Create a peak-season implementation work plan 3. Develop the parking ambassador program
4. Prepare communications and wayfinding package 5. Begin remote and employee parking outreach 6. Establish metrics and post-season reporting
Page 36
Text of page 36
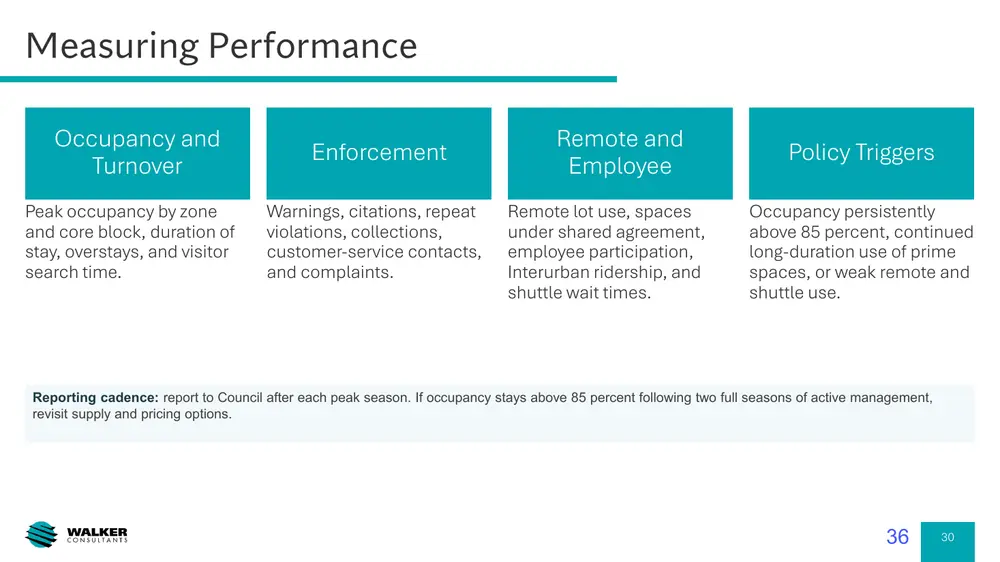
Measuring Performance Occupancy and Turnover
Enforcement
Peak occupancy by zone and core block, duration of stay, overstays, and visitor search time.
Warnings, citations, repeat violations, collections, customer-service contacts, and complaints.
Remote and Employee Remote lot use, spaces under shared agreement, employee participation, Interurban ridership, and shuttle wait times.
Policy Triggers Occupancy persistently above 85 percent, continued long-duration use of prime spaces, or weak remote and shuttle use.
Reporting cadence: report to Council after each peak season. If occupancy stays above 85 percent following two full seasons of active management, revisit supply and pricing options.
Page 37
Text of page 37
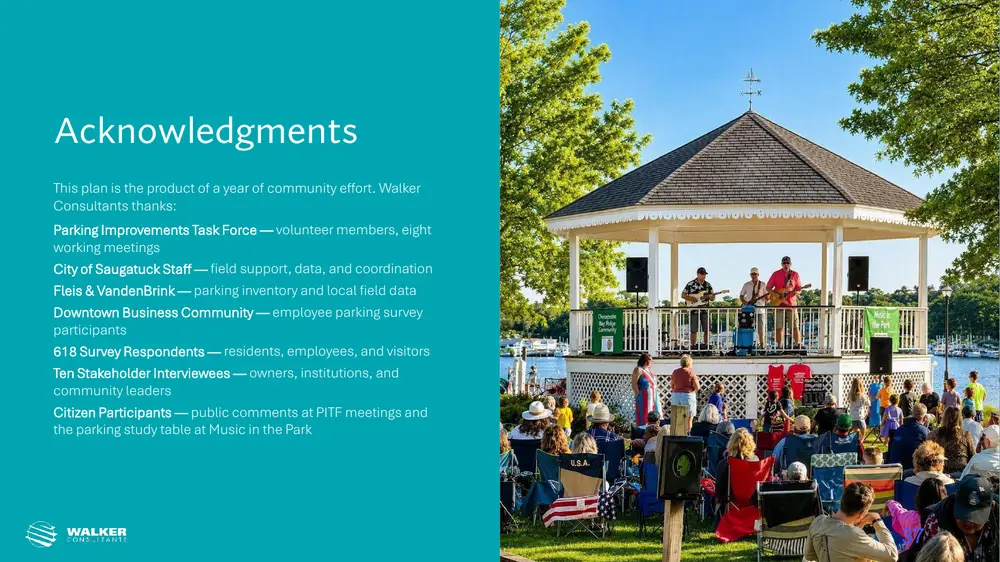
Acknowledgments This plan is the product of a year of community effort. Walker Consultants thanks: Parking Improvements Task Force — volunteer members, eight working meetings City of Saugatuck Staff — field support, data, and coordination Fleis & VandenBrink — parking inventory and local field data Downtown Business Community — employee parking survey participants 618 Survey Respondents — residents, employees, and visitors Ten Stakeholder Interviewees — owners, institutions, and community leaders Citizen Participants — public comments at PITF meetings and the parking study table at Music in the Park
Page 38
Text of page 38
Questions and Discussion
Page 39
Text of page 39
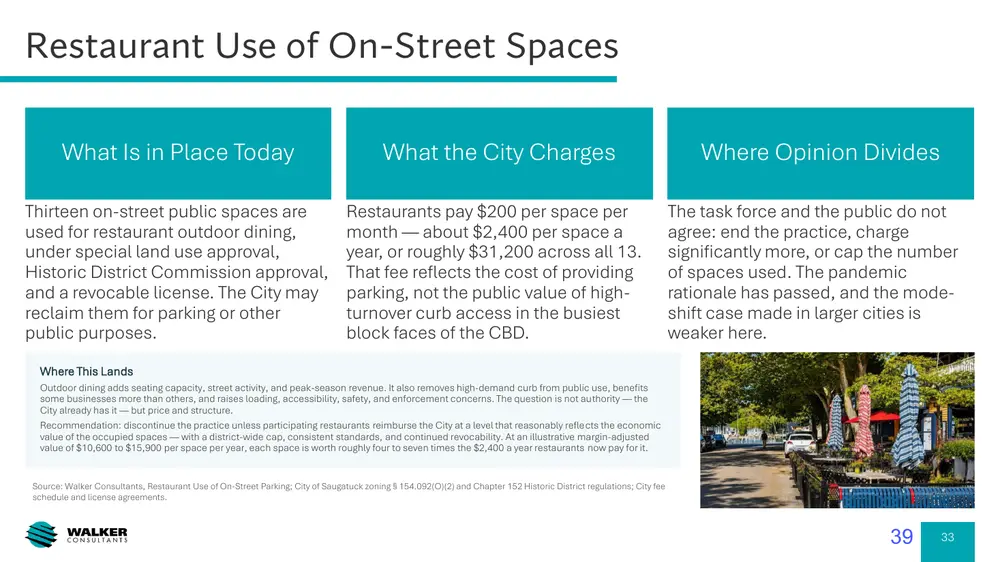
Restaurant Use of On-Street Spaces What Is in Place Today
What the City Charges
Where Opinion Divides
Thirteen on-street public spaces are used for restaurant outdoor dining, under special land use approval, Historic District Commission approval, and a revocable license. The City may reclaim them for parking or other public purposes.
Restaurants pay $200 per space per month — about $2,400 per space a year, or roughly $31,200 across all 13. That fee reflects the cost of providing parking, not the public value of highturnover curb access in the busiest block faces of the CBD.
The task force and the public do not agree: end the practice, charge significantly more, or cap the number of spaces used. The pandemic rationale has passed, and the modeshift case made in larger cities is weaker here.
Where This Lands Outdoor dining adds seating capacity, street activity, and peak-season revenue. It also removes high-demand curb from public use, benefits some businesses more than others, and raises loading, accessibility, safety, and enforcement concerns. The question is not authority — the City already has it — but price and structure. Recommendation: discontinue the practice unless participating restaurants reimburse the City at a level that reasonably reflects the economic value of the occupied spaces — with a district-wide cap, consistent standards, and continued revocability. At an illustrative margin-adjusted value of $10,600 to $15,900 per space per year, each space is worth roughly four to seven times the $2,400 a year restaurants now pay for it.
Source: Walker Consultants, Restaurant Use of On-Street Parking; City of Saugatuck zoning § 154.092(O)(2) and Chapter 152 Historic District regulations; City fee schedule and license agreements.